INTRODUCTION
Promoting and developing data about women-owned businesses has been one of the Council’s core duties since its inception, and this work is as crucial as ever, with Congress recently recommitting the federal government to evidence-based policymaking. Accordingly, data and original research are important sources of intelligence that inform NWBC’s policy recommendations. The Council regularly commissions research to address gaps, unanswered questions, and emerging opportunities; presents results and observations in academic and policymaking fora; and features discussions of new findings and insights from its own and partners’ work at its public meetings and roundtables.
In the past year, NWBC’s research activities included:
- Uplifting insights from the 2024 Impact of Women-Owned Businesses report, commissioned by Wells Fargo and authored by Ventureneer, CoreWoman, and the Women Impacting Public Policy (WIPP) Education Institute.
- Commissioning full results of the U.S. Census Bureau’s Center for Economic Studies’ analysis of the metamorphosis of women’s business ownership in the most recent decade and the effects of women business owners’ ages on their business prospects.
- Learning about factors affecting women’s science, technology, engineering, and mathematics (STEM) business ownership and rural and Tribal women entrepreneurs’ experiences through commissioned econometric analysis, interviews, and surveys.
- Preparing to launch research into women business owners’ experiences with and benefits of strengthening Women-Owned Small Business (WOSB) contracting programs and into data driven methods to sustain the post-pandemic surge of Black and Latina business startups.
This report includes key findings from these research activities, including the forthcoming update to the 2024 Impact of Women-Owned Businesses report, for which NWBC gratefully thanks Geri Stengel (Ventureneer), Adji Fatou Diagne (U.S. Census Bureau), Kajal Kapur (Kapur Energy Environment Economics [KEEE], LLC), Elizabeth Schieber (dfusion, Inc.), and their collaborators and organizations. These experts’ work shows that women are breaking through barriers that have persistently driven economic inequity—increasing presence among those earning advanced STEM degrees and active in industries like transportation— though disparities are still visible and influential. Results of the research NWBC commissioned indicate that more education and growth-oriented technical assistance for women can’t be the entirety of our solution. Support for women entrepreneurs could improve with the inclusion of, for example, advocacy for family care and encouragement to build businesses around social missions.
Report Excerpt: THE 2024 IMPACT OF WOMEN-OWNED BUSINESSES
We are grateful for the opportunity to present a preview of key findings from the forthcoming updated report from Wells Fargo in collaboration with Ventureneer, CoreWoman, and the WIPP Education Institute.
Women Entrepreneurs Driving Economic Growth
Since the pandemic, the United States has witnessed a remarkable surge in business formations, particularly among women-owned businesses. The rise in these businesses—initially sparked by pandemic-related factors such as increased entrepreneurial spirit, shifting consumer behaviors, increased government support, and more personal time and savings—has continued. The sustained growth of these businesses is fueled by evolving priorities towards flexibility and autonomy, greater access to digital tools, changing social norms, economic necessity, and the discovery of untapped market opportunities.
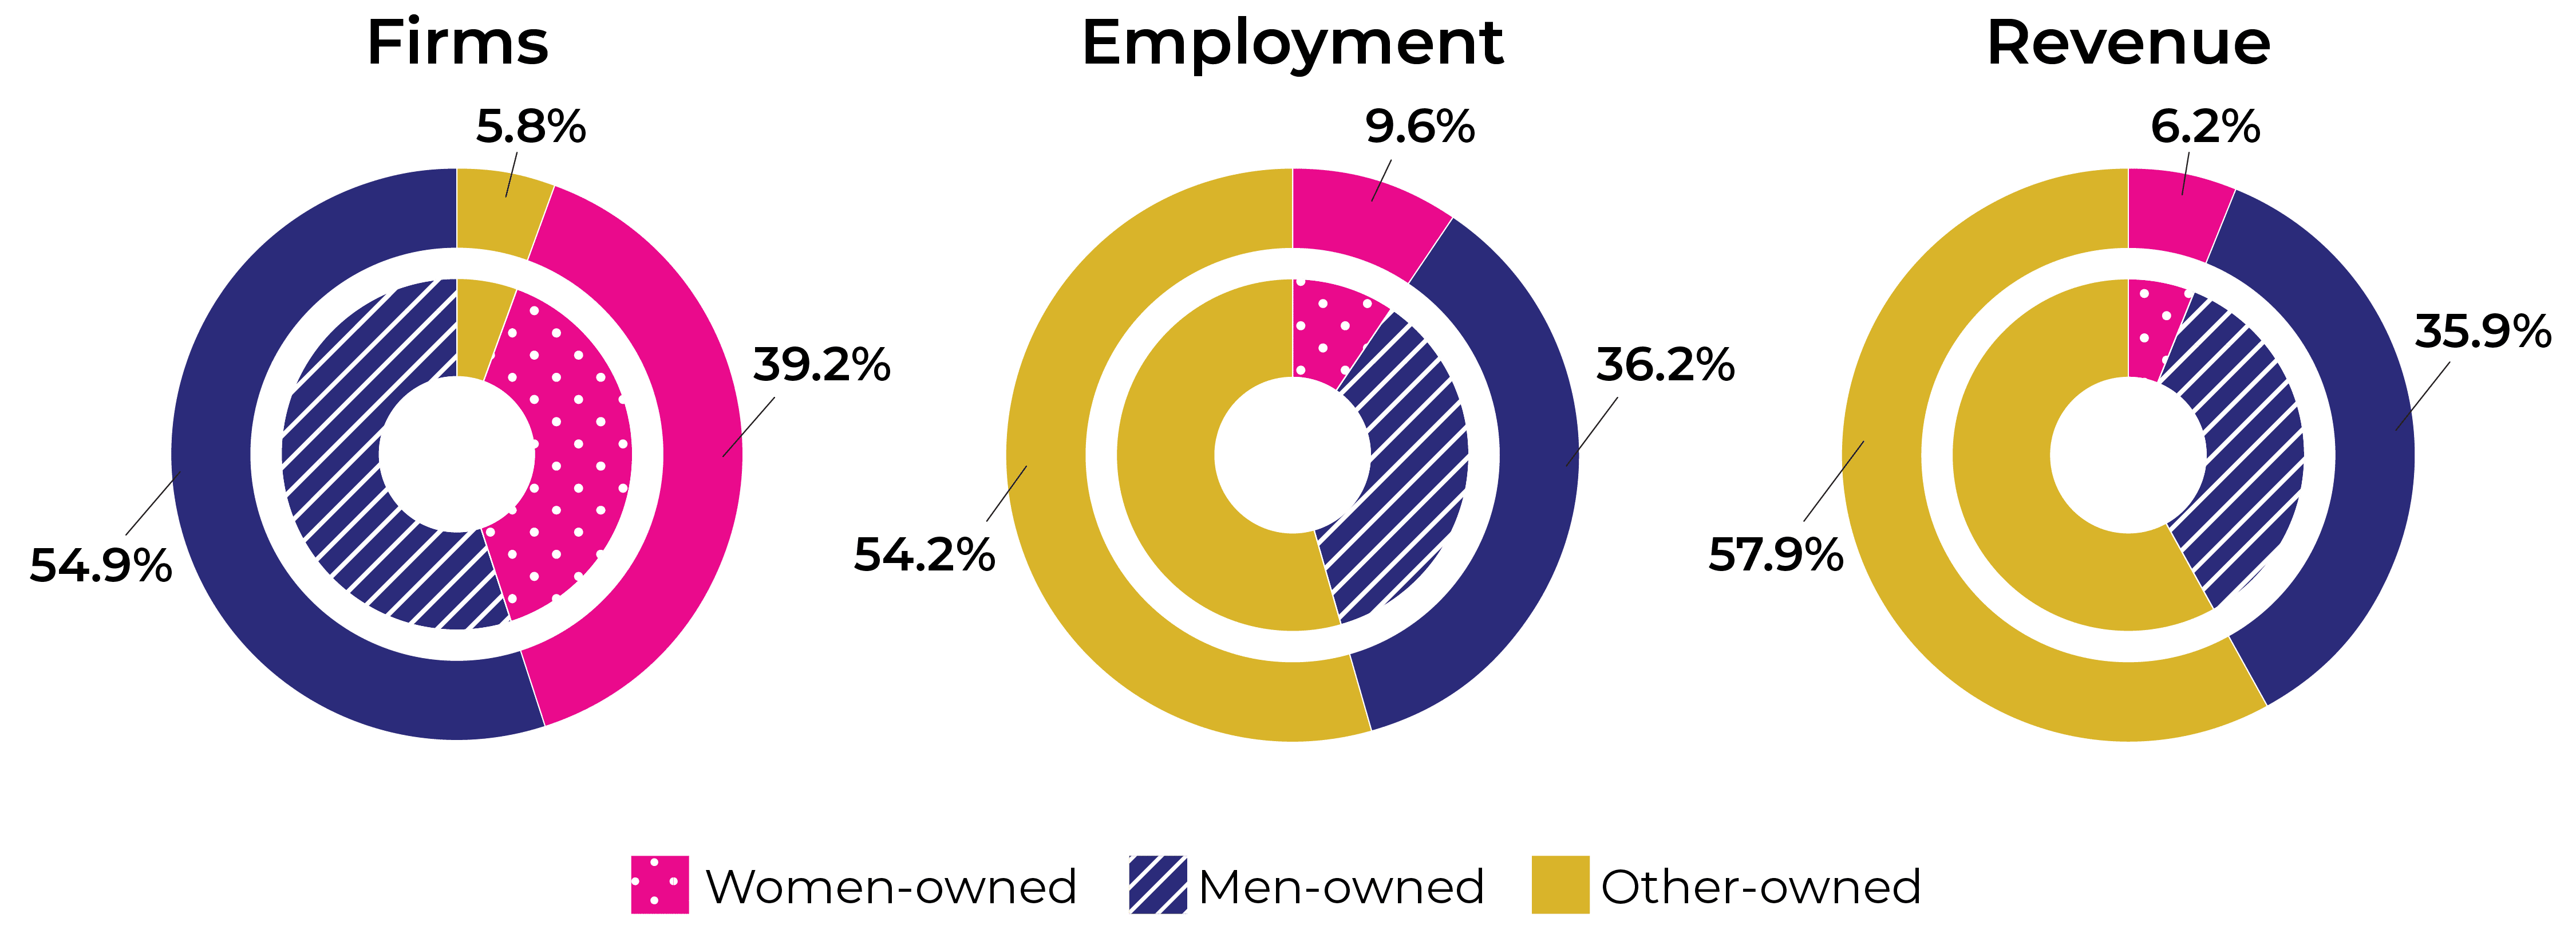
Women-owned businesses are a driving force in the U.S. economy, accounting for 39.2 percent of all enterprises and employing 12.9 million workers. While men-owned businesses still hold a larger share (54.9 percent), women-owned businesses are making significant strides, contributing a remarkable $3.3 trillion in annual revenue. These numbers highlight women entrepreneurs’ growing influence and increasingly pivotal role in shaping the American business landscape.
The Impact of Women-Owned Businesses

The Entrepreneurship Divide is Closing Very Slowly
While women-owned businesses constitute nearly 40 percent of all U.S. enterprises, their impact on employment (9.6 percent) and revenue (6.2 percent) still lags behind their overall representation.
Figure 1. 2024 Share of Firms, Employment, and Revenue by Gender
The Long Road to Revenue Equality
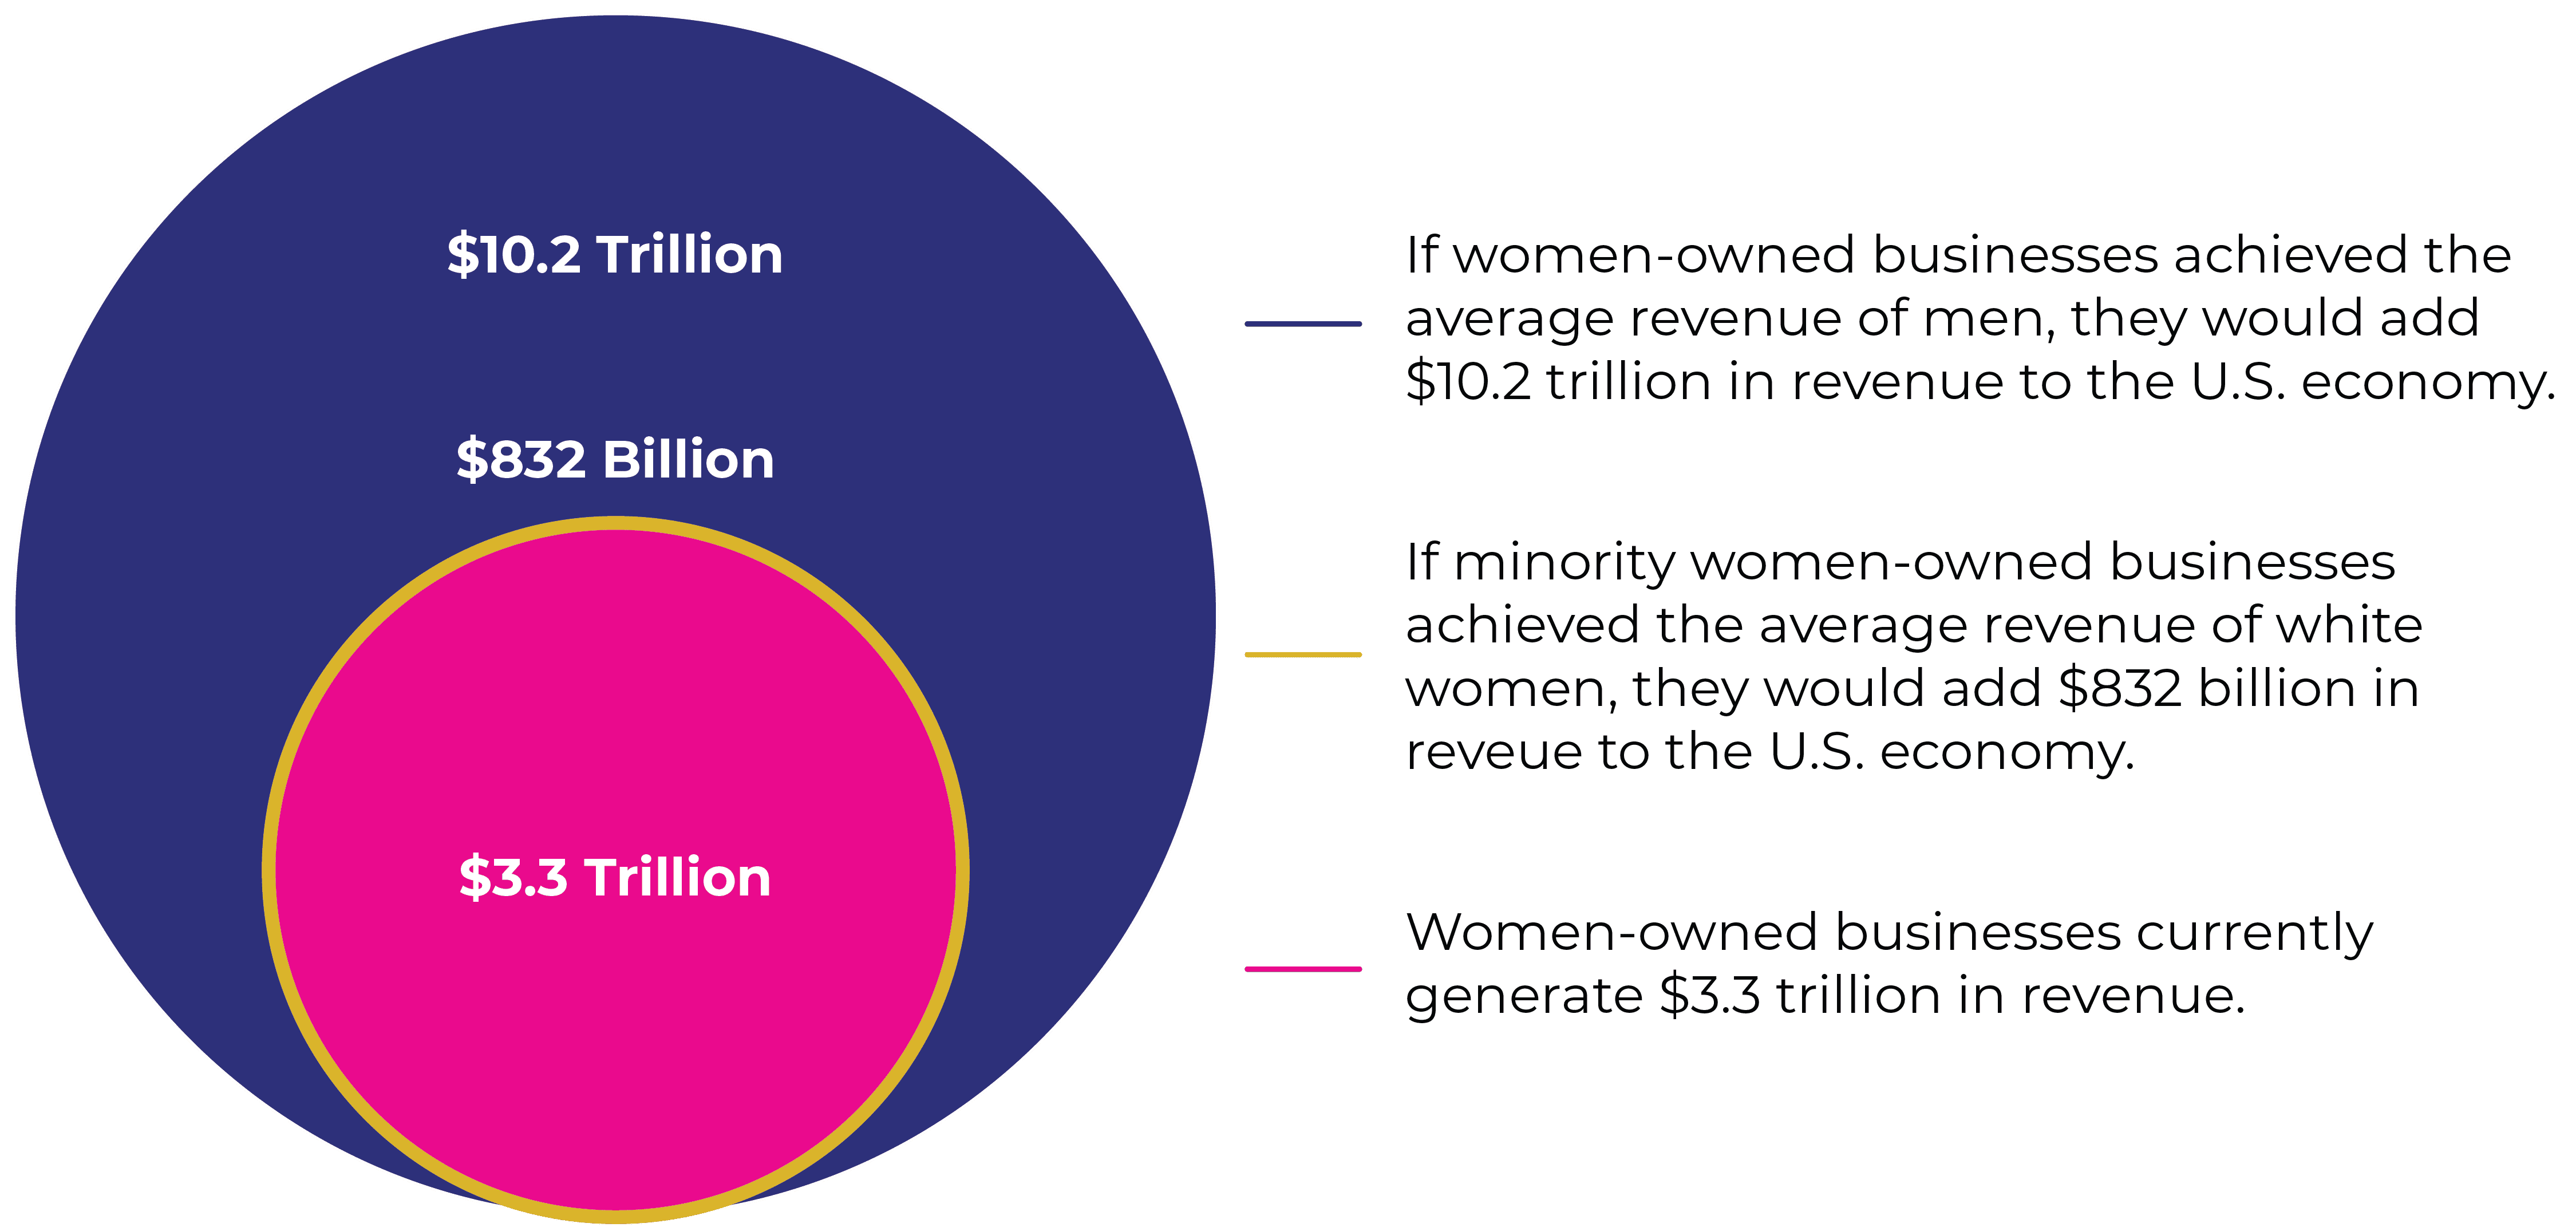
If all women-owned businesses achieved the same average revenue as men-owned businesses, the U.S. economy would see a massive $10.2 trillion in additional revenue. Compared to the current $3.3 trillion generated by women-owned businesses in 2024, this potential growth underscores the immense potential economic impact of closing the revenue gap between women-owned and men-owned businesses.
Figure 2. Closing the Gap in Average Revenue Would Make a Significant Impact on the U.S. Economy
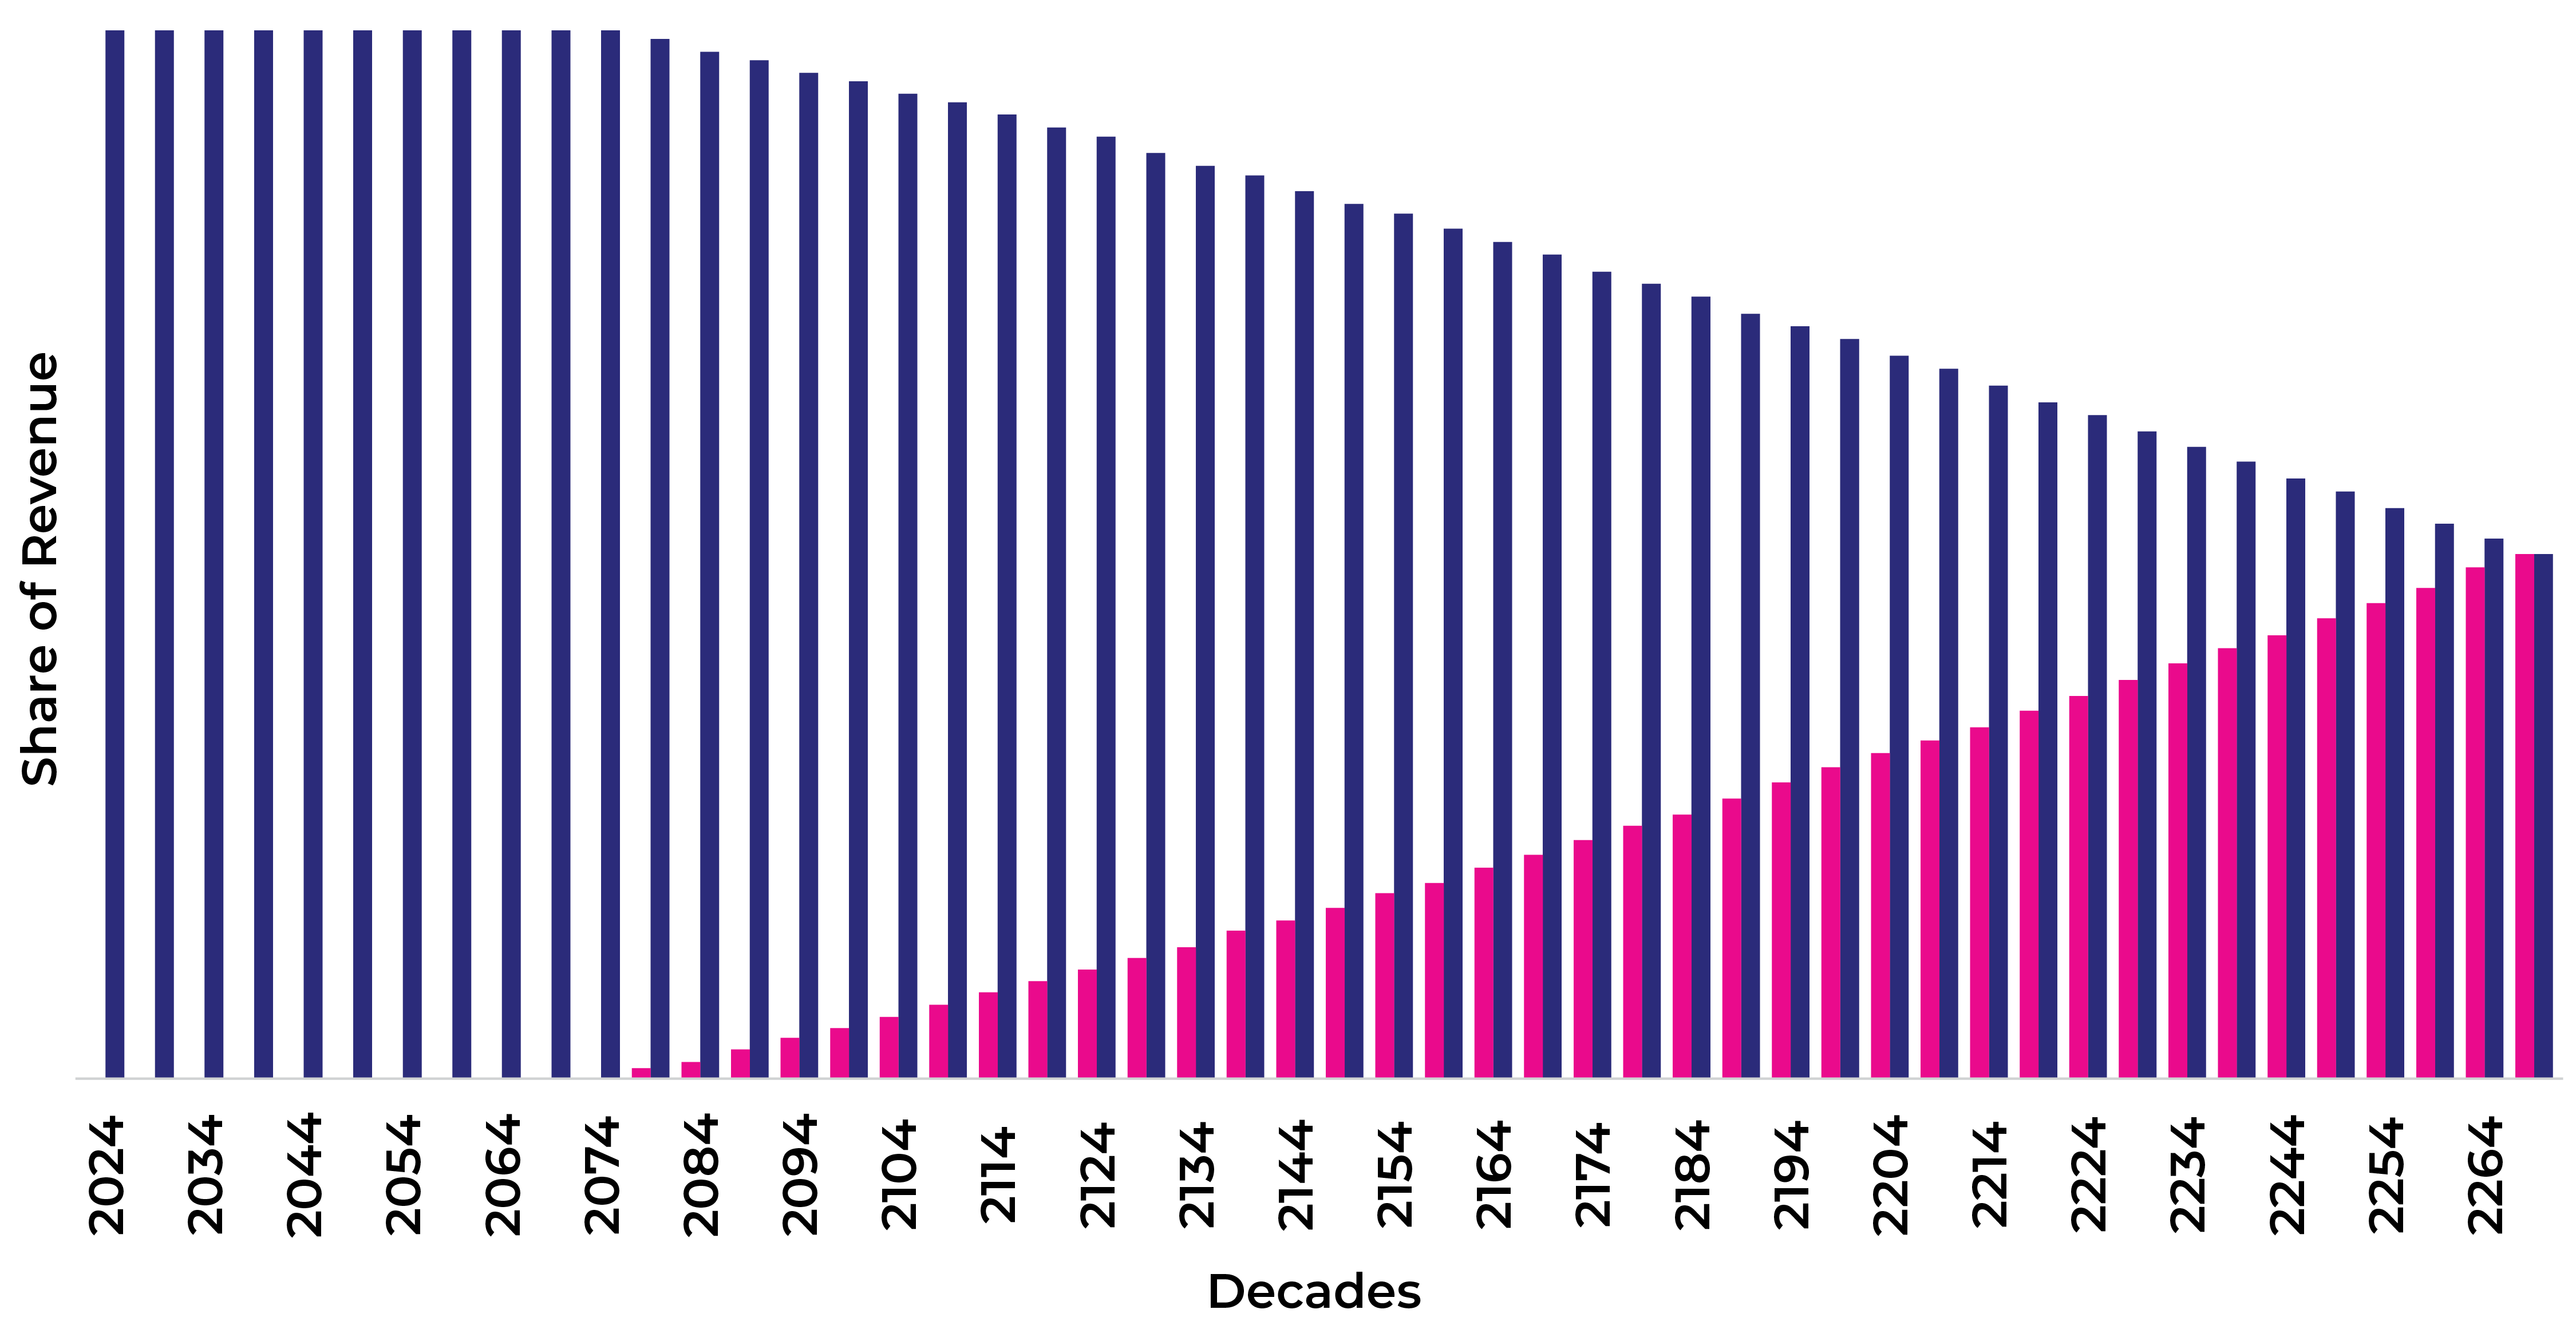
At the current rate of progress, it would take a staggering 120 years for women-owned businesses to generate the same revenue as men-owned businesses.
Figure 3. Revenue Share Growth for Women-Owned Businesses
Industry Trends: Women Are Active in More Industries
While five industries have traditionally dominated women-owned businesses, a notable shift occurs as women entrepreneurs increasingly venture into diverse sectors such as food and accommodations, real estate, and transportation and warehousing. This diversification reduces the concentration of women-owned businesses in the previously dominant industries, signaling a broadening of entrepreneurial opportunities for women across sectors.
This trend is driven by evolving societal norms, increased access to resources, flexible work arrangements, supportive ecosystems, and other economic factors influencing women’s industry choices. A shift away from the “other services” sector highlights a growing preference among women for industries that offer a balance of flexibility, stability, and growth potential.
Figure 4. Industry Trends for Women-Owned Businesses
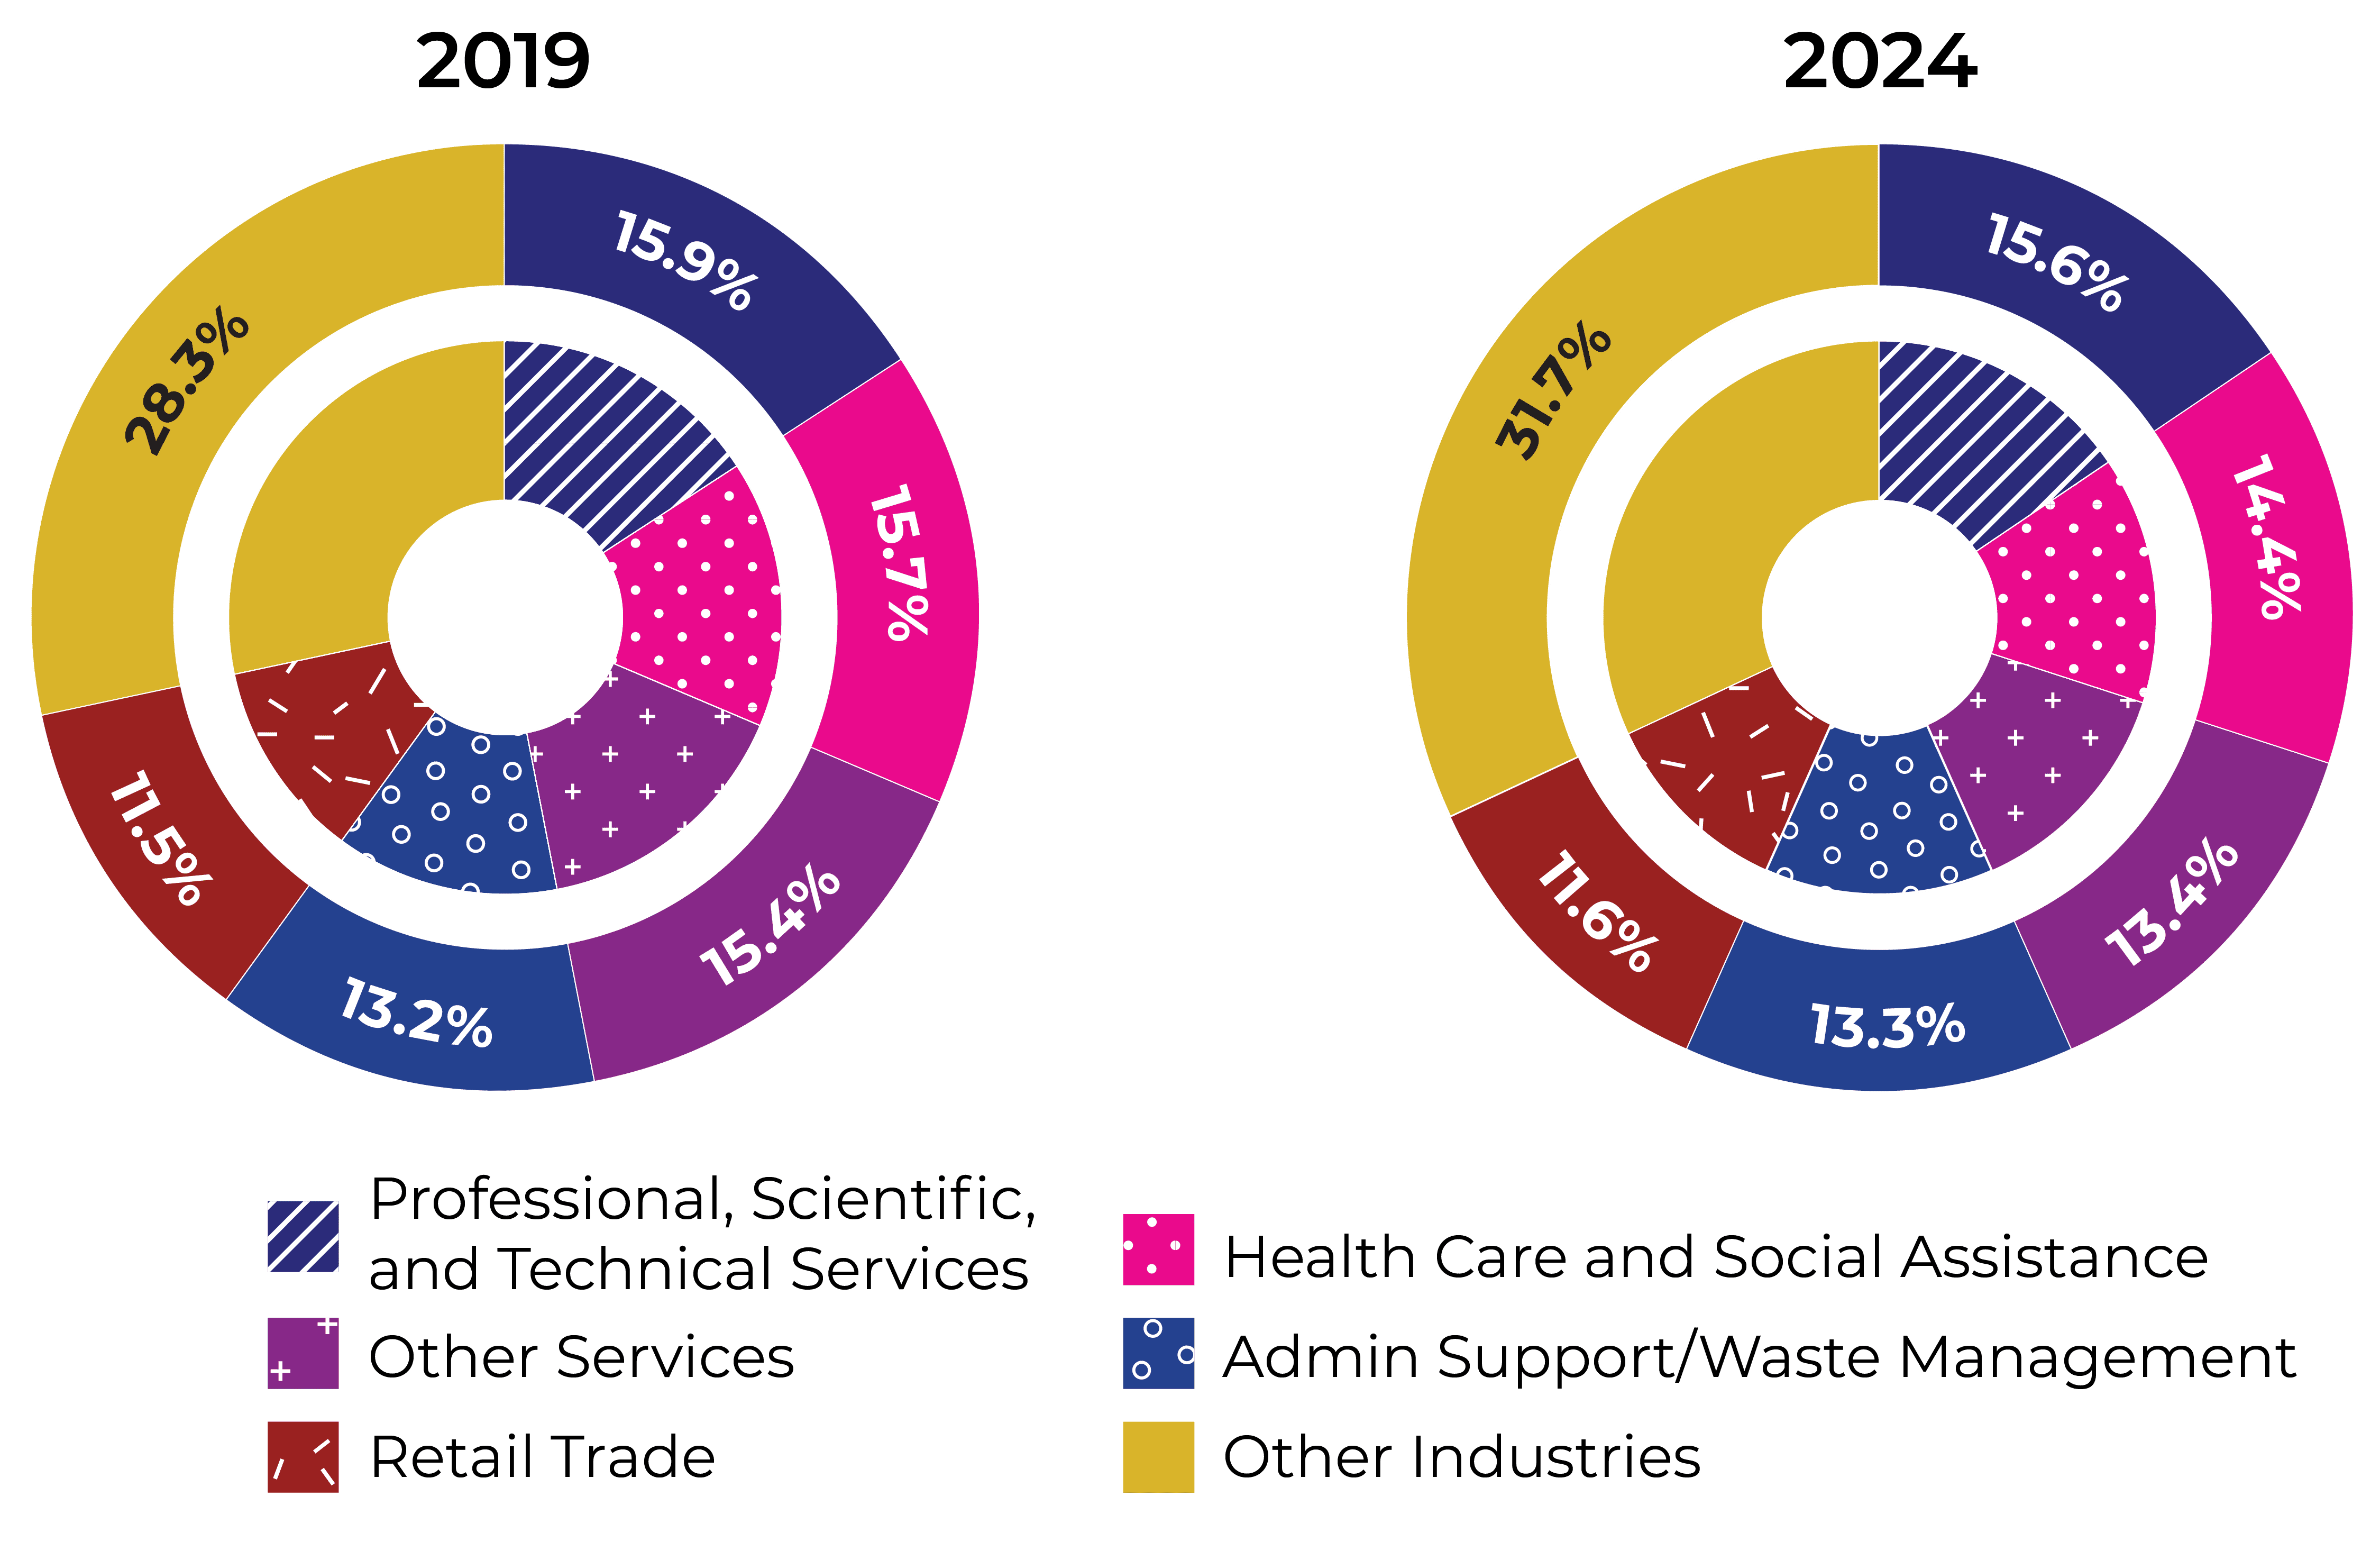
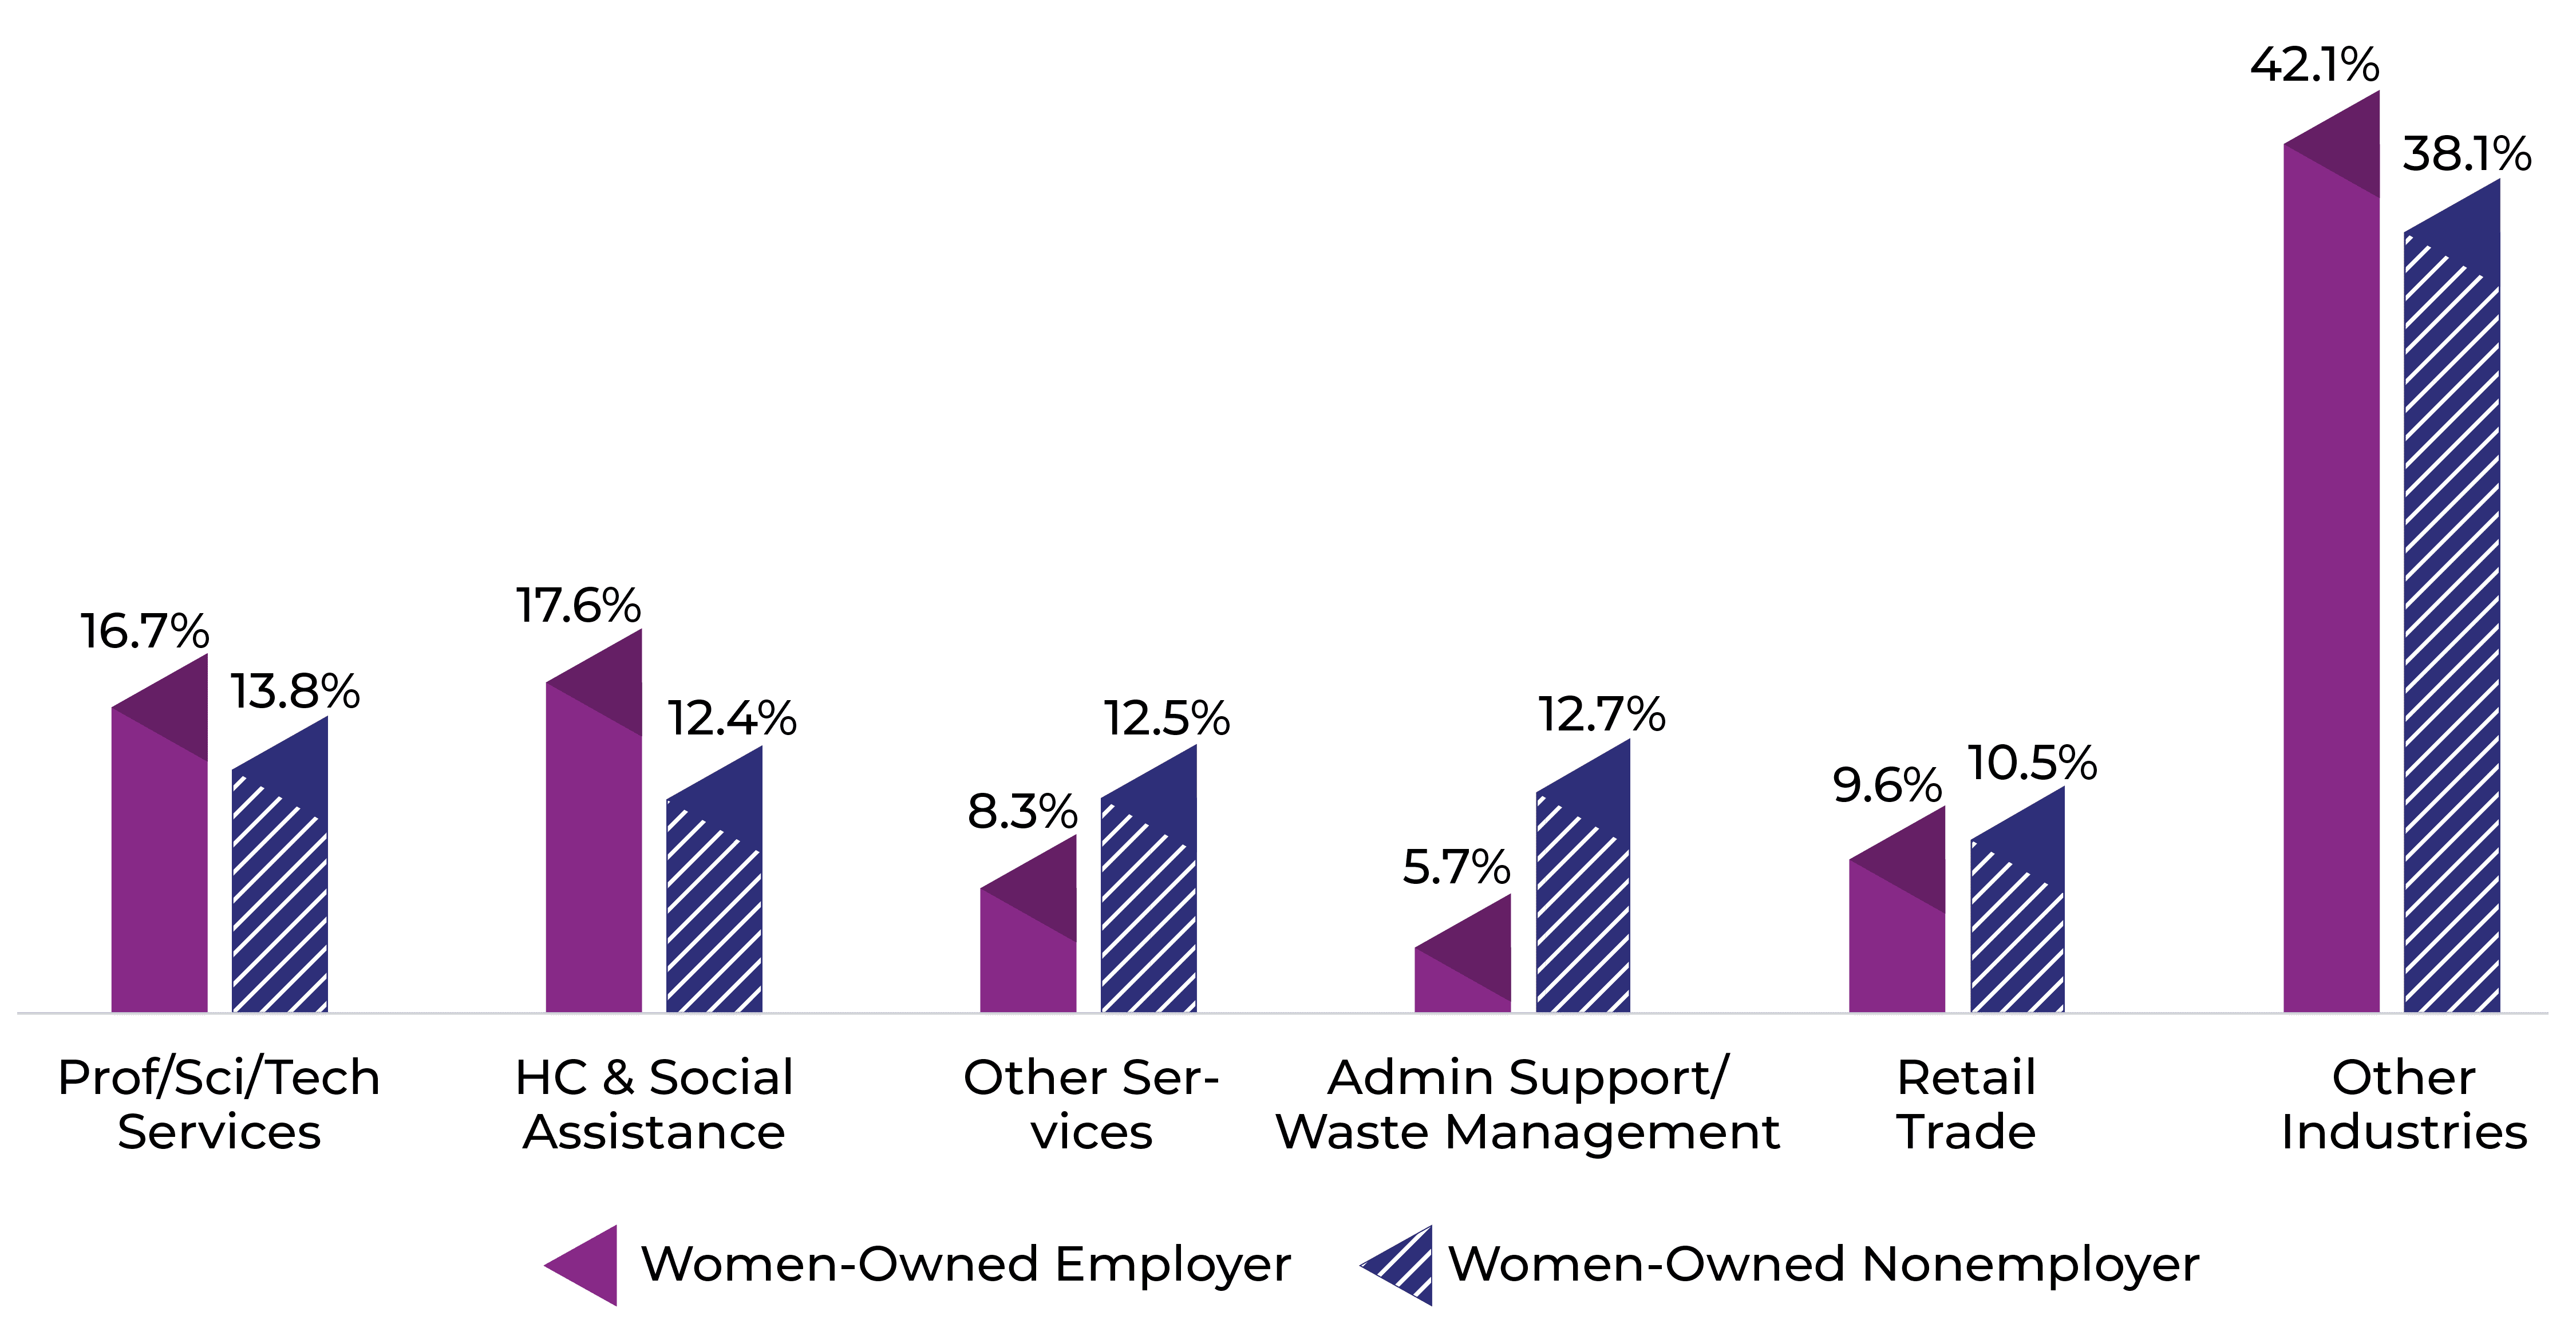
There are differences in the industry concentration between women-owned employers and nonemployers. Women-owned employers are more likely than nonemployers to be in:
- Professional, scientific, and technical services (e.g., legal, bookkeeping, and consulting).
- Health care and social assistance (e.g., child daycare and home care providers, mental health practitioners, and physicians).
- Other industries (e.g., accommodations and food, construction, and finance and insurance).
Several factors contribute to why women-owned employers are more likely to be found in these industries, including education and expertise, market demand, supplier diversity programs that connect women-owned businesses to government and corporate business development opportunities, and networking and mentorship programs.
Women-owned nonemployers are more likely than employers to be in:
- Other services (e.g., hair and nail salons, pet care, laundries, and dry cleaners).
- Administrative and support and waste management and remediation services (e.g., office administration, staffing agencies, and security and surveillance services).
Several factors contribute to why women-owned employers are more likely to be found in these industries, including lower capital requirements, flexibility and autonomy, ease of entry, fewer regulatory hurdles, and simpler business legal structures.
Figure 5. 2024 Comparison of Industry Share of Firms for Employer and Nonemployer Women-Owned Businesses
From Pandemic Lessons to Lasting Change: Empowering Women Entrepreneurs
The undeniable impact of women-owned businesses is tempered by the alarming reality of a 12-decade wait for revenue parity with men-owned businesses. This stark disparity underscores the urgent need to dismantle systemic barriers and accelerate progress toward economic gender equality.
Pursuing gender parity in business ownership isn’t just a social imperative; it’s a potential economic powerhouse. Empowering women entrepreneurs can unleash trillions in gross domestic product growth, create millions of jobs, and foster a more innovative and resilient economy—ultimately benefiting everyone.
THE METAMORPHOSIS OF A WOMAN BUSINESS OWNER: A FOCUS ON AGE
NWBC’s duties center on the collection of data about women’s businesses, and the Council is fortunate to partner with the U.S. Census Bureau and Dr. Adji Fatou Diagne of its Center for Economic Studies to produce responsive tables and analysis. Below are excerpts of Dr. Diagne’s work on changes in women-owned businesses as owners age.
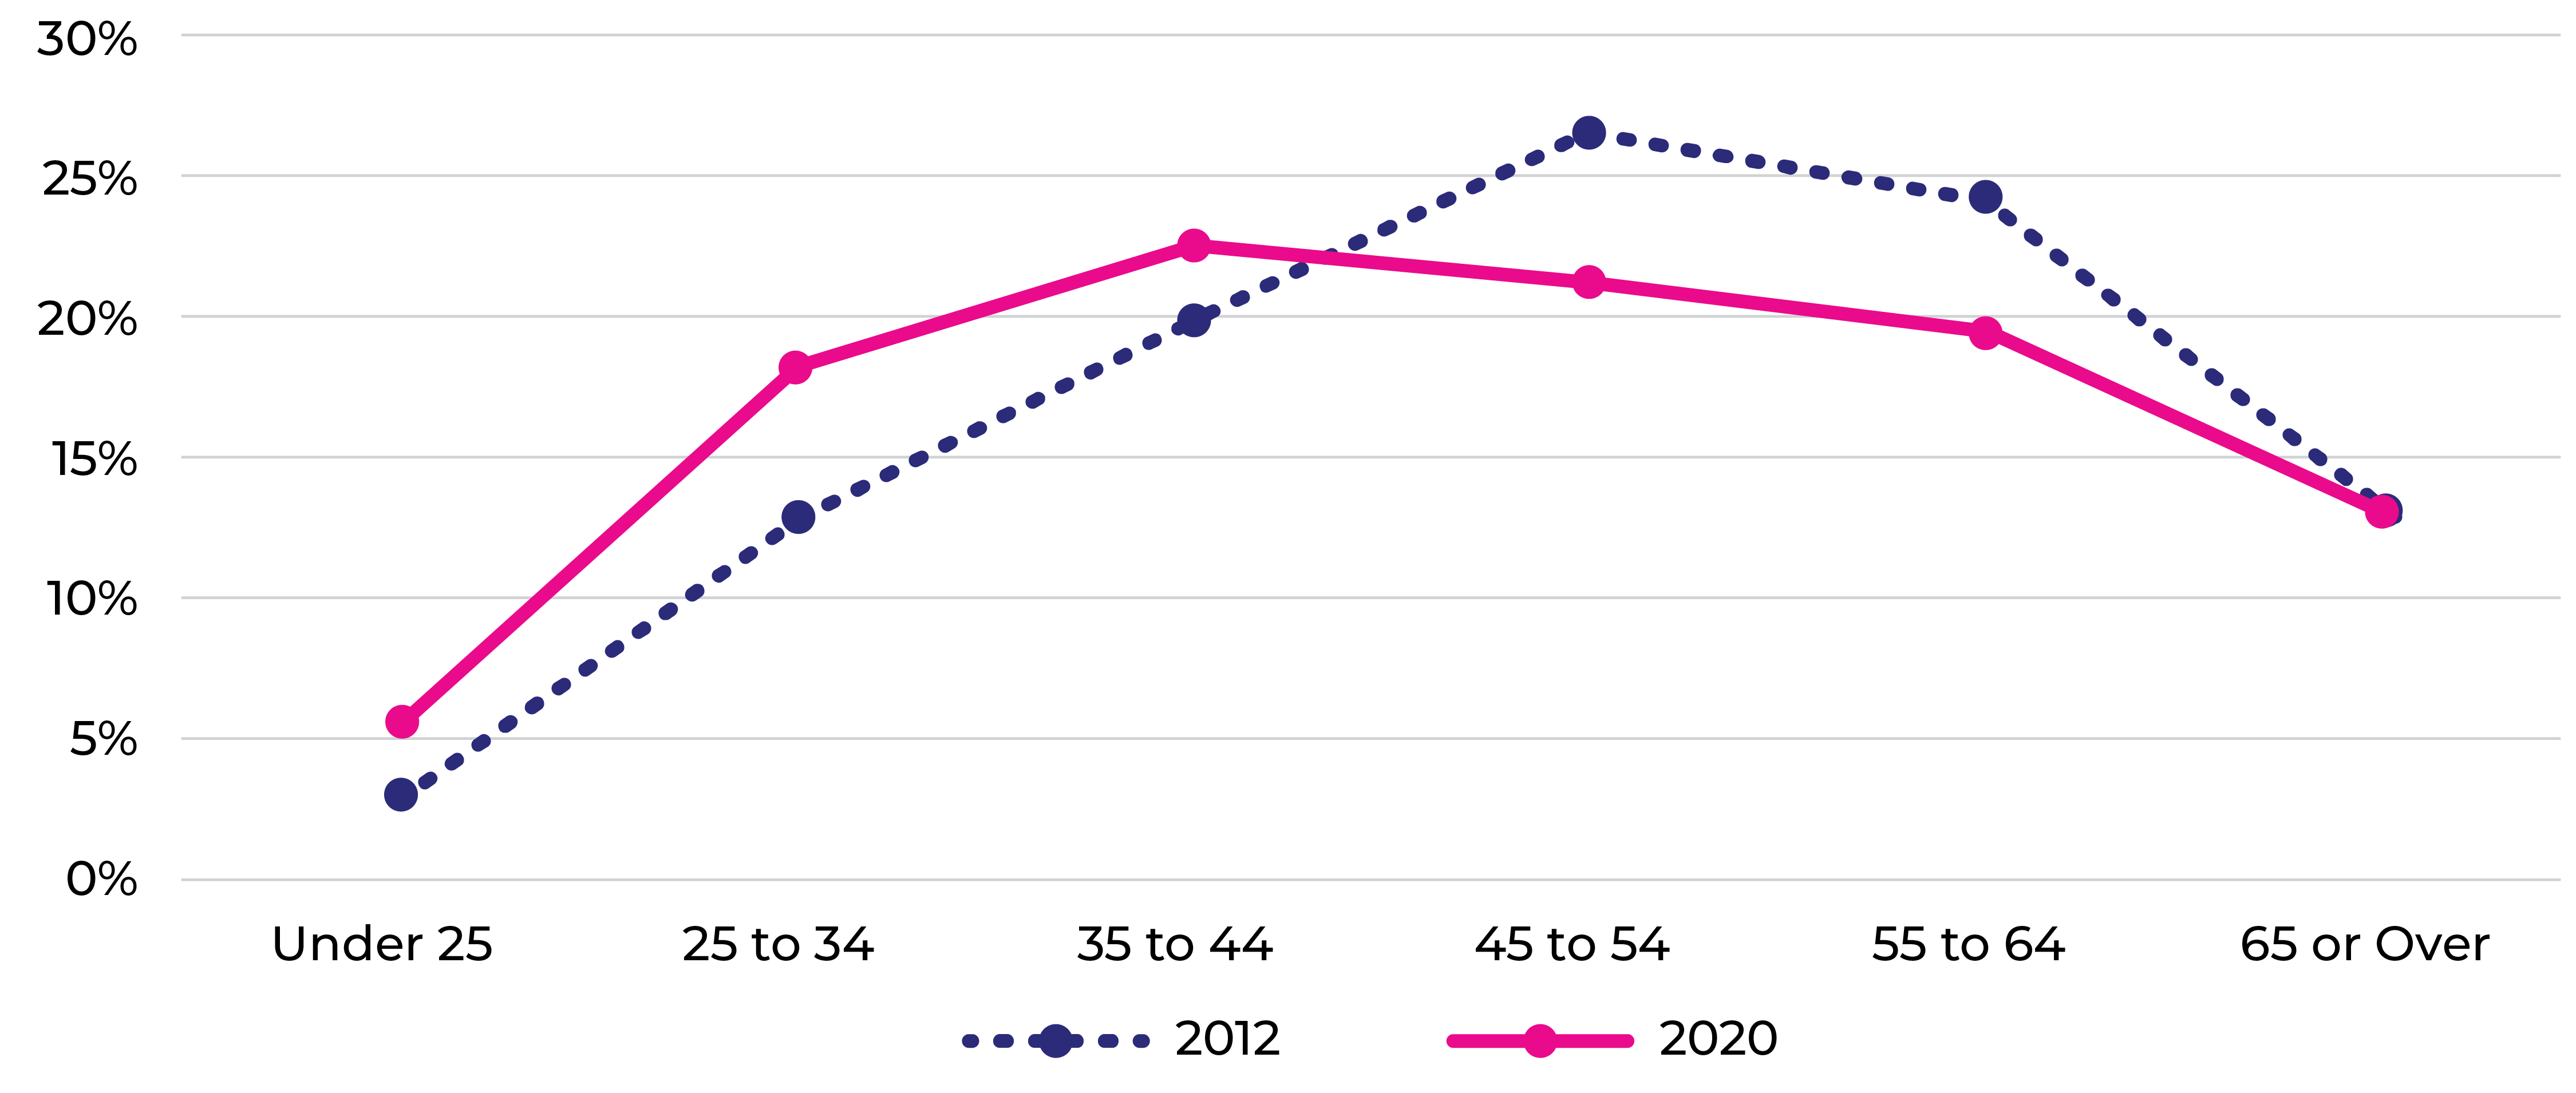
Considering women entrepreneurs’ increasing performance and growth, policymakers, researchers, and advocacy groups continue to express interest in learning more about them. Previous work1 has looked into the distribution of businesses by race and ethnicity across time, but very little is known about how women’s relationship with entrepreneurship changes over time by age.2 Women business owners are generally older, with 77.7 percent aged 35 and over in 2020.3 A recent study has also found that the highest success rates in entrepreneurship in the United States come from founders in their middle age and beyond (Azoulay et al. 2020).4 These findings are consistent with theories that align entrepreneurial resources such as human capital, financial capital, and social capital with age. However, the distribution of ownership by age group has slightly changed in the past eight years. For example, the share of women business owners under the age of 45 rose 10.5 percentage points between 2012 and 2020, while ownership for those over 45 declined by fairly the same rate (10.4 percentage points). Particularly, women ages 25 to 34 posted the largest increase (+5.4 percentage points) in business ownership, while those in the 45 to 54 age group had the largest decline (-5.5 percentage points).
Figure 6. Women Business Ownership by Age (2012–2020)
Sources: U.S. Census Bureau, 2012 Survey of Business Owners, 2021 Annual Business Survey, data year 2020, and 2020 Nonemployer Statistics by Demographics (NES-D).
Age appears to play a role in the type of businesses5 that women own and the industry sectors in which they operate. In terms of industry concentration, we observe striking differences in business owners’ age. Table 1 provides the top 5 industries with the highest shares of women owners aged 55 and over and those under 35 years old among women owners in a particular industry. For instance, women over 55 were heavily represented among women owners of employer businesses in more capital-intensive industries in 2020. These industries include mining, quarrying, and oil and gas extraction, where they accounted for 72.6 percent of women owners in that industry; management of companies and enterprises (67.2 percent), manufacturing (62.4 percent), and wholesale trade (62.3 percent). Women under 35 were most represented among women owners of employer businesses in labor-intensive industries such as those in the arts, entertainment, and recreation sector with a share of 11.9 percent, information (9.3 percent), accommodation and food services (8.1 percent) and other services (except public administration) 6 with 7.6 percent.
Table 1. Top 5 Industries: Employer Businesses
| Oldest Owners (55 and over) | Industry Share | Youngest Owner (Under 35) | Industry Share |
|---|---|---|---|
| Mining, quarrying, and oil and gas .. | 72.6% | Arts, entertainment, and recreation | 11.90% |
| Management of companies and enterprises | 67.2% | Information | 9.30% |
| Manufacturing | 62.4% | Accommodation and food services | 8.10% |
| Wholesale trade | 62.3% | Other services (except public admin) | 7.60% |
| Industries not classified | 60.7% | Agriculture, forestry, fishing and hunting | 7.30% |
Note: The industries not classified category comprises establishments where no North American Industry Classification System (NAICS) coding information is available.
Source: U.S. Census Bureau, 2021 Annual Business Survey, data year 2020.
We observe similar statistics for nonemployer business owners, where industries that require more capital to operate are owned by older women. The top sector, commonly shared with employer businesses, is mining, quarrying, and oil and gas extraction, with 71.2 percent of women owners in that industry over the age of 55. The remaining businesses are real estate and rental and leasing (52.3 percent), utilities (44.3 percent), finance and insurance (44.0 percent), and wholesale trade (36.4 percent). Findings for younger (less than 35 years old) women employer owners also align with those for nonemployer businesses. Younger women owners are more represented in nonemployer businesses that require less capital to start, except for the transportation and warehousing industry, where they account for 41.1 percent of owners.
Table 2. Top 5 Industries: Nonemployer Businesses
| Oldest Owners (55 and over) | Industry Share | Youngest Owner (Under 35) | Industry Share |
|---|---|---|---|
| Mining, quarrying, and oil and gas .. | 71.2% | Transportation and warehousing | 41.1% |
| Real estate and rental and leasing | 52.3% | Arts, entertainment, and recreation | 36.4% |
| Utilities | 44.3% | Other services (except public admin) | 31.9% |
| Finance and insurance | 44.0% | Information | 31.4% |
| Wholesale trade | 36.4% | Agriculture, forestry, fishing and hunting | 30.5% |
Source: U.S. Census Bureau, 2020 Nonemployer Statistics by Demographics (NES-D).
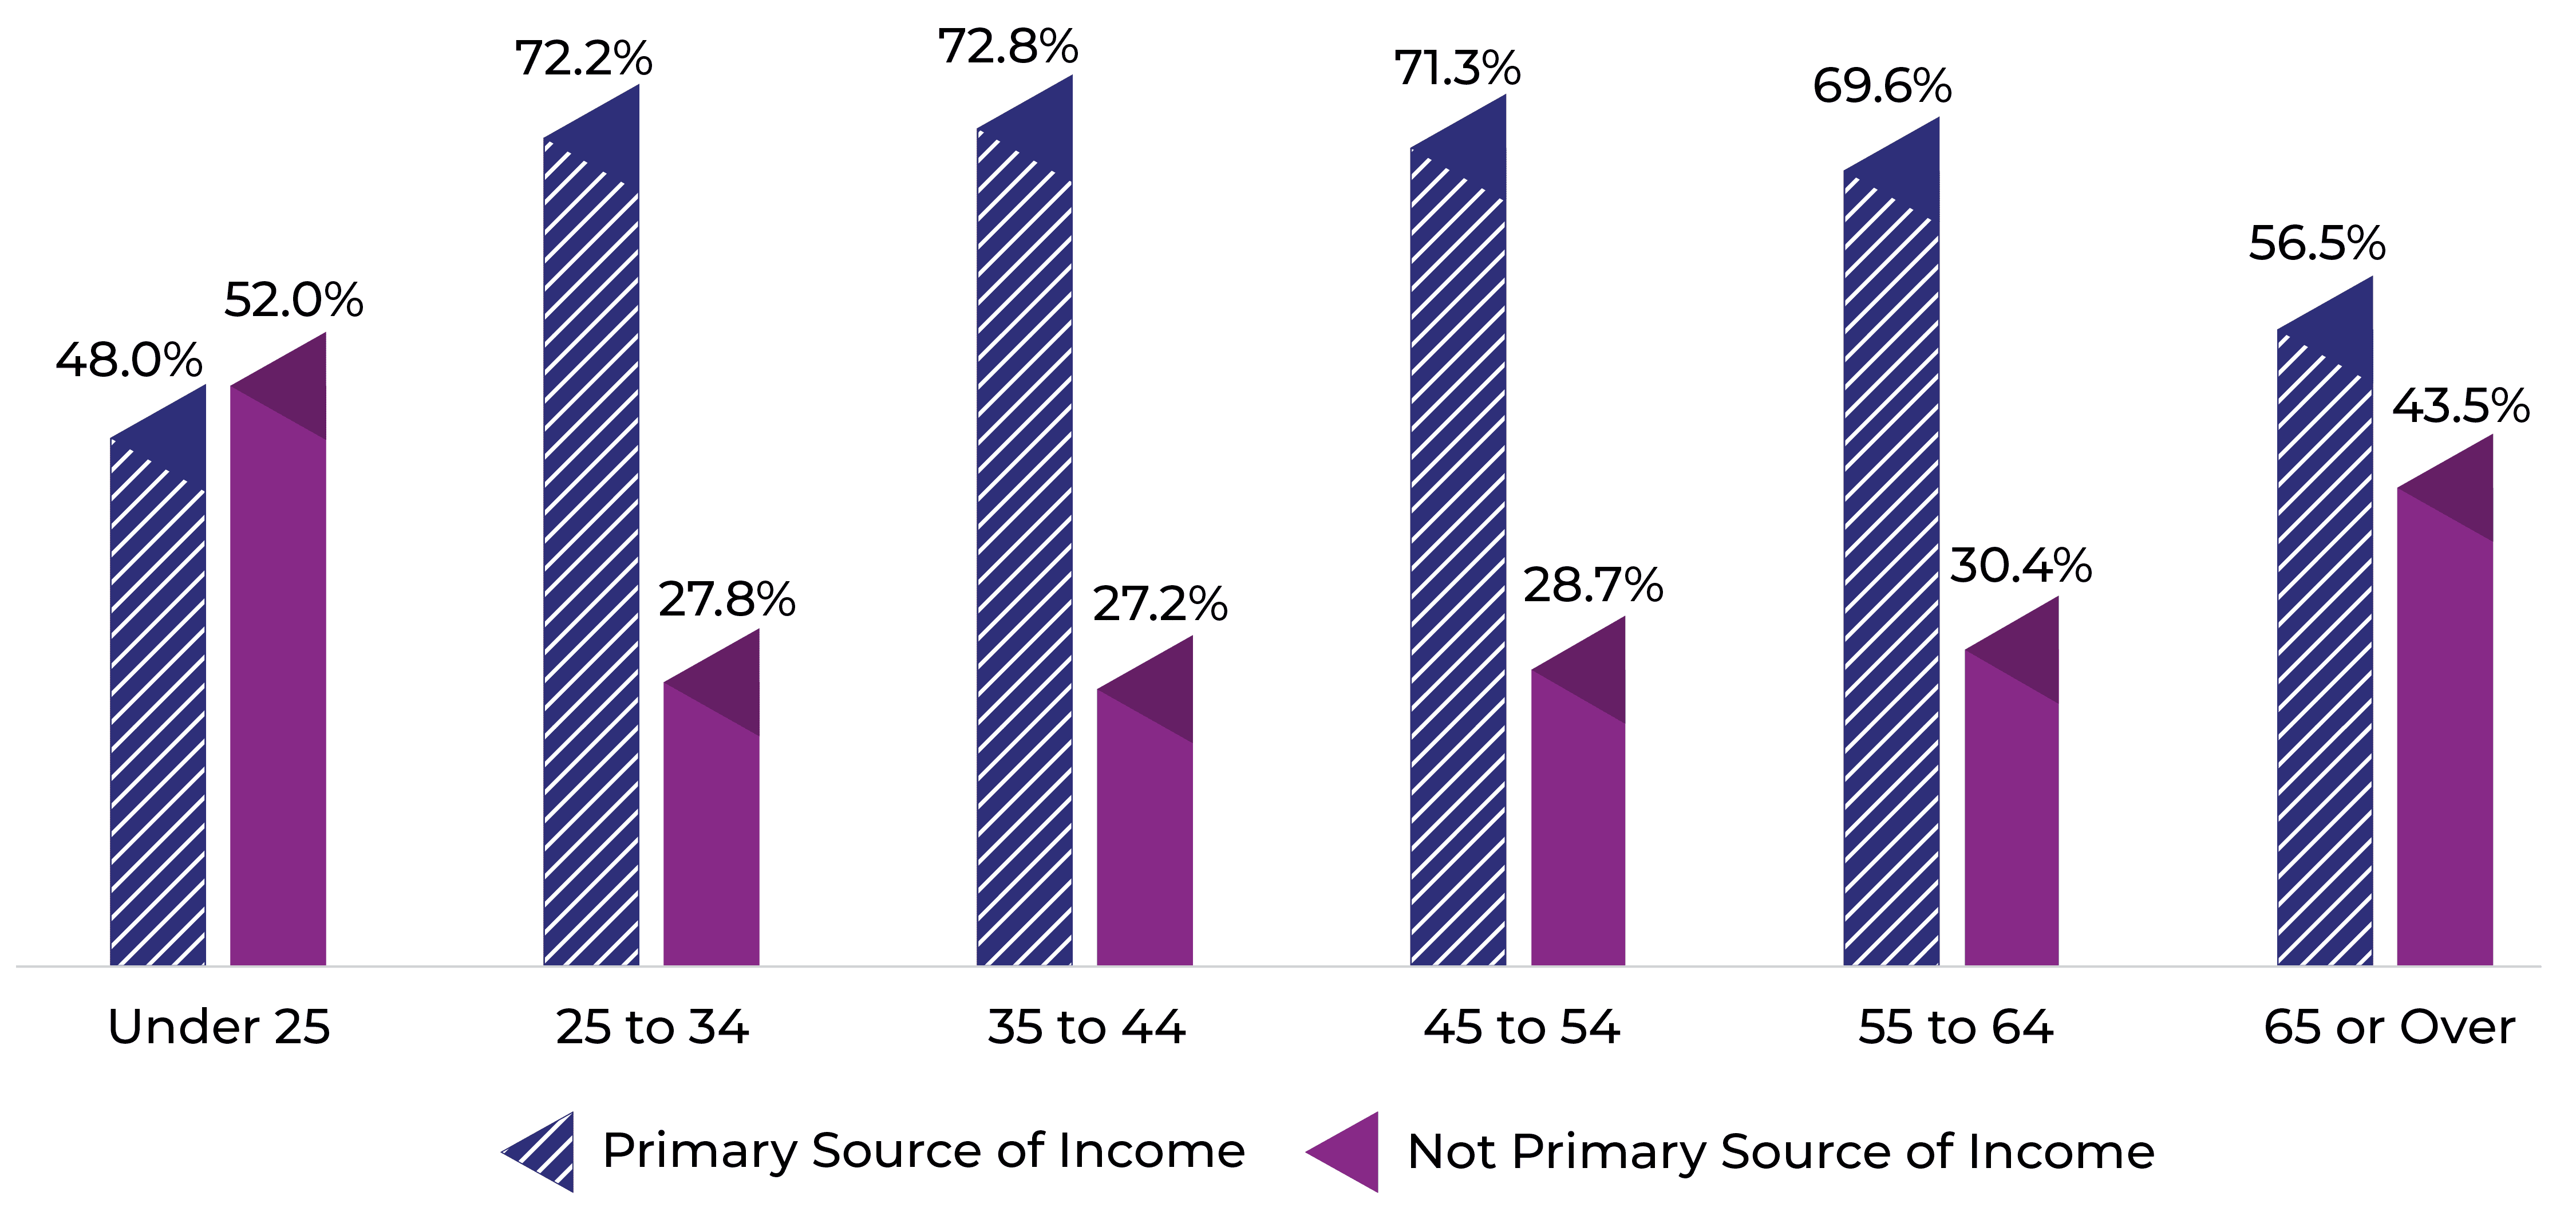
Women owners mainly rely on their businesses as their primary source of personal income. More than two-third (68.0 percent) reported that their business in question was their primary source of income in 2021. However, this share is relatively different by owner age. For instance, 48.0 percent of women owners under 25 said their business was their primary source of income, while 52.0 percent said it was not that same year. On the contrary, 56.5 percent of those aged 65 and over said the business was their primary source of income compared to 43.5 percent who reported it was not.
Figure 7. Women Employer Business Owners by Age and Source of Income
Source: U.S. Census Bureau, 2022 Annual Business Survey, data year 2021.
We explore the reasons for owning the business question by owner’s age. Table 4 provides these reasons by category, including not important, somewhat important, and very important. To highlight a few, 26.6 percent of owners under 25 years old and 23.5 percent of those 65 and older reported that balancing work and family is not important, while 70.5 percent of owners aged 35 to 44 and 67.1 percent of those 25 to 34 responded very important in 2021. These results can be characterized by these age groups’ potential family building. Younger owners also said that their reason for starting the business was the inability to find a job, with 11.2 percent of those under 25 stating this reason to be very important versus 4.9 percent of owners 65 and over. Minor shares of respondents in all age groups reported that the inability to find a job was an important reason for starting the business, potentially implying a strong labor market for women. Another interesting reason demonstrating the desire to become an entrepreneur among young and early middle-age groups is that of wanting to be their own boss, with 61.1 percent of owners aged 25 to 34 and 60.9 percent of those 35 to 44 reporting that this reason was very important. These results compare with 39.9 percent of owners under 25 and 44.0 percent of owners 65 and over. Having flexible hours was also very important for the age groups 25 to 34 and 35 to 44, with 64.6 percent and 65.6 percent of owners, respectively. Only 25.1 percent of responding owners under the age of 25 and 26.9 percent of those 65 and older reported this reason to be very important.
Table 4. Women Employer Business Owners by Age and Reason for Owning the Business
| Reasons for Owning the Business | Under 25 | 25 to 34 | 35 to 44 | 45 to 54 | 55 to 64 | 65 or Over |
|---|---|---|---|---|---|---|
| Balance work and family: Not important | 26.6% | 10.1% | 8.8% | 11.3% | 15.8% | 23.5% |
| Balance work and family: Somewhat important | 28.2% | 22.9% | 20.7% | 24.6% | 28.2% | 29.7% |
| Balance work and family: Very important | 45.2% | 67.1% | 70.5% | 64.1% | 56.0% | 46.8% |
| Best avenue for ideas: Not important | 27.2% | 12.5% | 14.6% | 18.3% | 22.5% | 29.0% |
| Best avenue for ideas: Somewhat important | 34.1% | 29.8% | 30.6% | 31.0% | 30.7% | 30.0% |
| Best avenue for ideas: Very important | 38.7% | 57.6% | 54.9% | 50.7% | 46.9% | 41.0% |
| Carry on family business: Not important | 44.6% | 61.8% | 67.1% | 69.2% | 69.4% | 64.8% |
| Carry on family business: Somewhat important | 26.2% | 17.2% | 14.9% | 14.9% | 13.9% | 14.4% |
| Carry on family business: Very important | 29.2% | 21.0% | 18.8% | 15.9% | 16.7% | 20.8% |
| Couldn't find a job: Not important | 70.7% | 75.6% | 76.9% | 79.4% | 81.4% | 83.5% |
| Couldn't find a job: Somewhat important | 18.1% | 16.8% | 9.9% | 14.6% | 12.7% | 11.6% |
| Couldn't find a job: Very important | 11.2% | 7.4% | 8.1% | 6.5% | 5.9% | 4.9% |
| Flexible hours: Not important | 25.1% | 10.9% | 10.6% | 13.7% | 18.1% | 26.9% |
| Flexible hours: Somewhat important | 27.9% | 24.5% | 23.8% | 26.4% | 28.3% | 29.3% |
| Flexible hours: Very important | 47.1% | 64.6% | 65.6% | 59.9% | 53.3% | 43.8% |
| Friend or family role model: Not important | 35.7% | 34.2% | 41.7% | 46.3% | 50.9% | 55.6% |
| Friend or family role model: Somewhat important | 28.9% | 30.1% | 28.2% | 27.5% | 24.9% | 23.0% |
| Friend or family role model: Very important | 35.4% | 35.7% | 30.2% | 26.3% | 24.3% | 21.5% |
| Greater income: Not important | 24.5% | 9.3% | 9.0% | 11.4% | 15.5% | 23.6% |
| Greater income: Somewhat important | 34.5% | 26.8% | 26.7% | 29.5% | 31.5% | 31.8% |
| Greater income: Very important | 41.0% | 63.9% | 64.2% | 59.1% | 53.0% | 44.6% |
| Help my community: Not important | 41.9% | 28.0% | 31.0% | 36.8% | 43.2% | 47.7% |
| Help my community: Somewhat important | 26.6% | 36.2% | 35.8% | 34.4% | 33.0% | 30.8% |
| Help my community: Very important | 31.4% | 35.8% | 33.2% | 28.7% | 23.7% | 21.5% |
| Start my own business: Not important | 34.8% | 21.4% | 25.7% | 29.0% | 33.8% | 41.8% |
| Start my own business: Somewhat important | 32.6% | 32.5% | 32.1% | 32.1% | 31.3% | 28.9% |
| Start my own business: Very important | 32.5% | 46.0% | 42.3% | 39.0% | 34.9% | 29.3% |
| Wanted to be my own boss: Not important | 26.6% | 11.8% | 11.9% | 14.8% | 19.0% | 27.2% |
| Wanted to be my own boss: Somewhat important | 33.5% | 27.2% | 27.2% | 28.4% | 29.0% | 28.8% |
| Wanted to be my own boss: Very important | 39.9% | 61.1% | 60.9% | 56.8% | 52.0% | 44.0% |
| Work for self: Not important | 44.5% | 28.1% | 31.1% | 35.6% | 40.1% | 45.5% |
| Work for self: Somewhat important | 30.7% | 38.9% | 38.6% | 36.7% | 34.3% | 30.9% |
| Work for self: Very important | 24.8% | 33.0% | 30.2% | 27.7% | 25.6% | 23.6% |
Source: U.S. Census Bureau, 2022 Annual Business Survey, data year 2021.
Selected Statistics by Race and Ethnicity
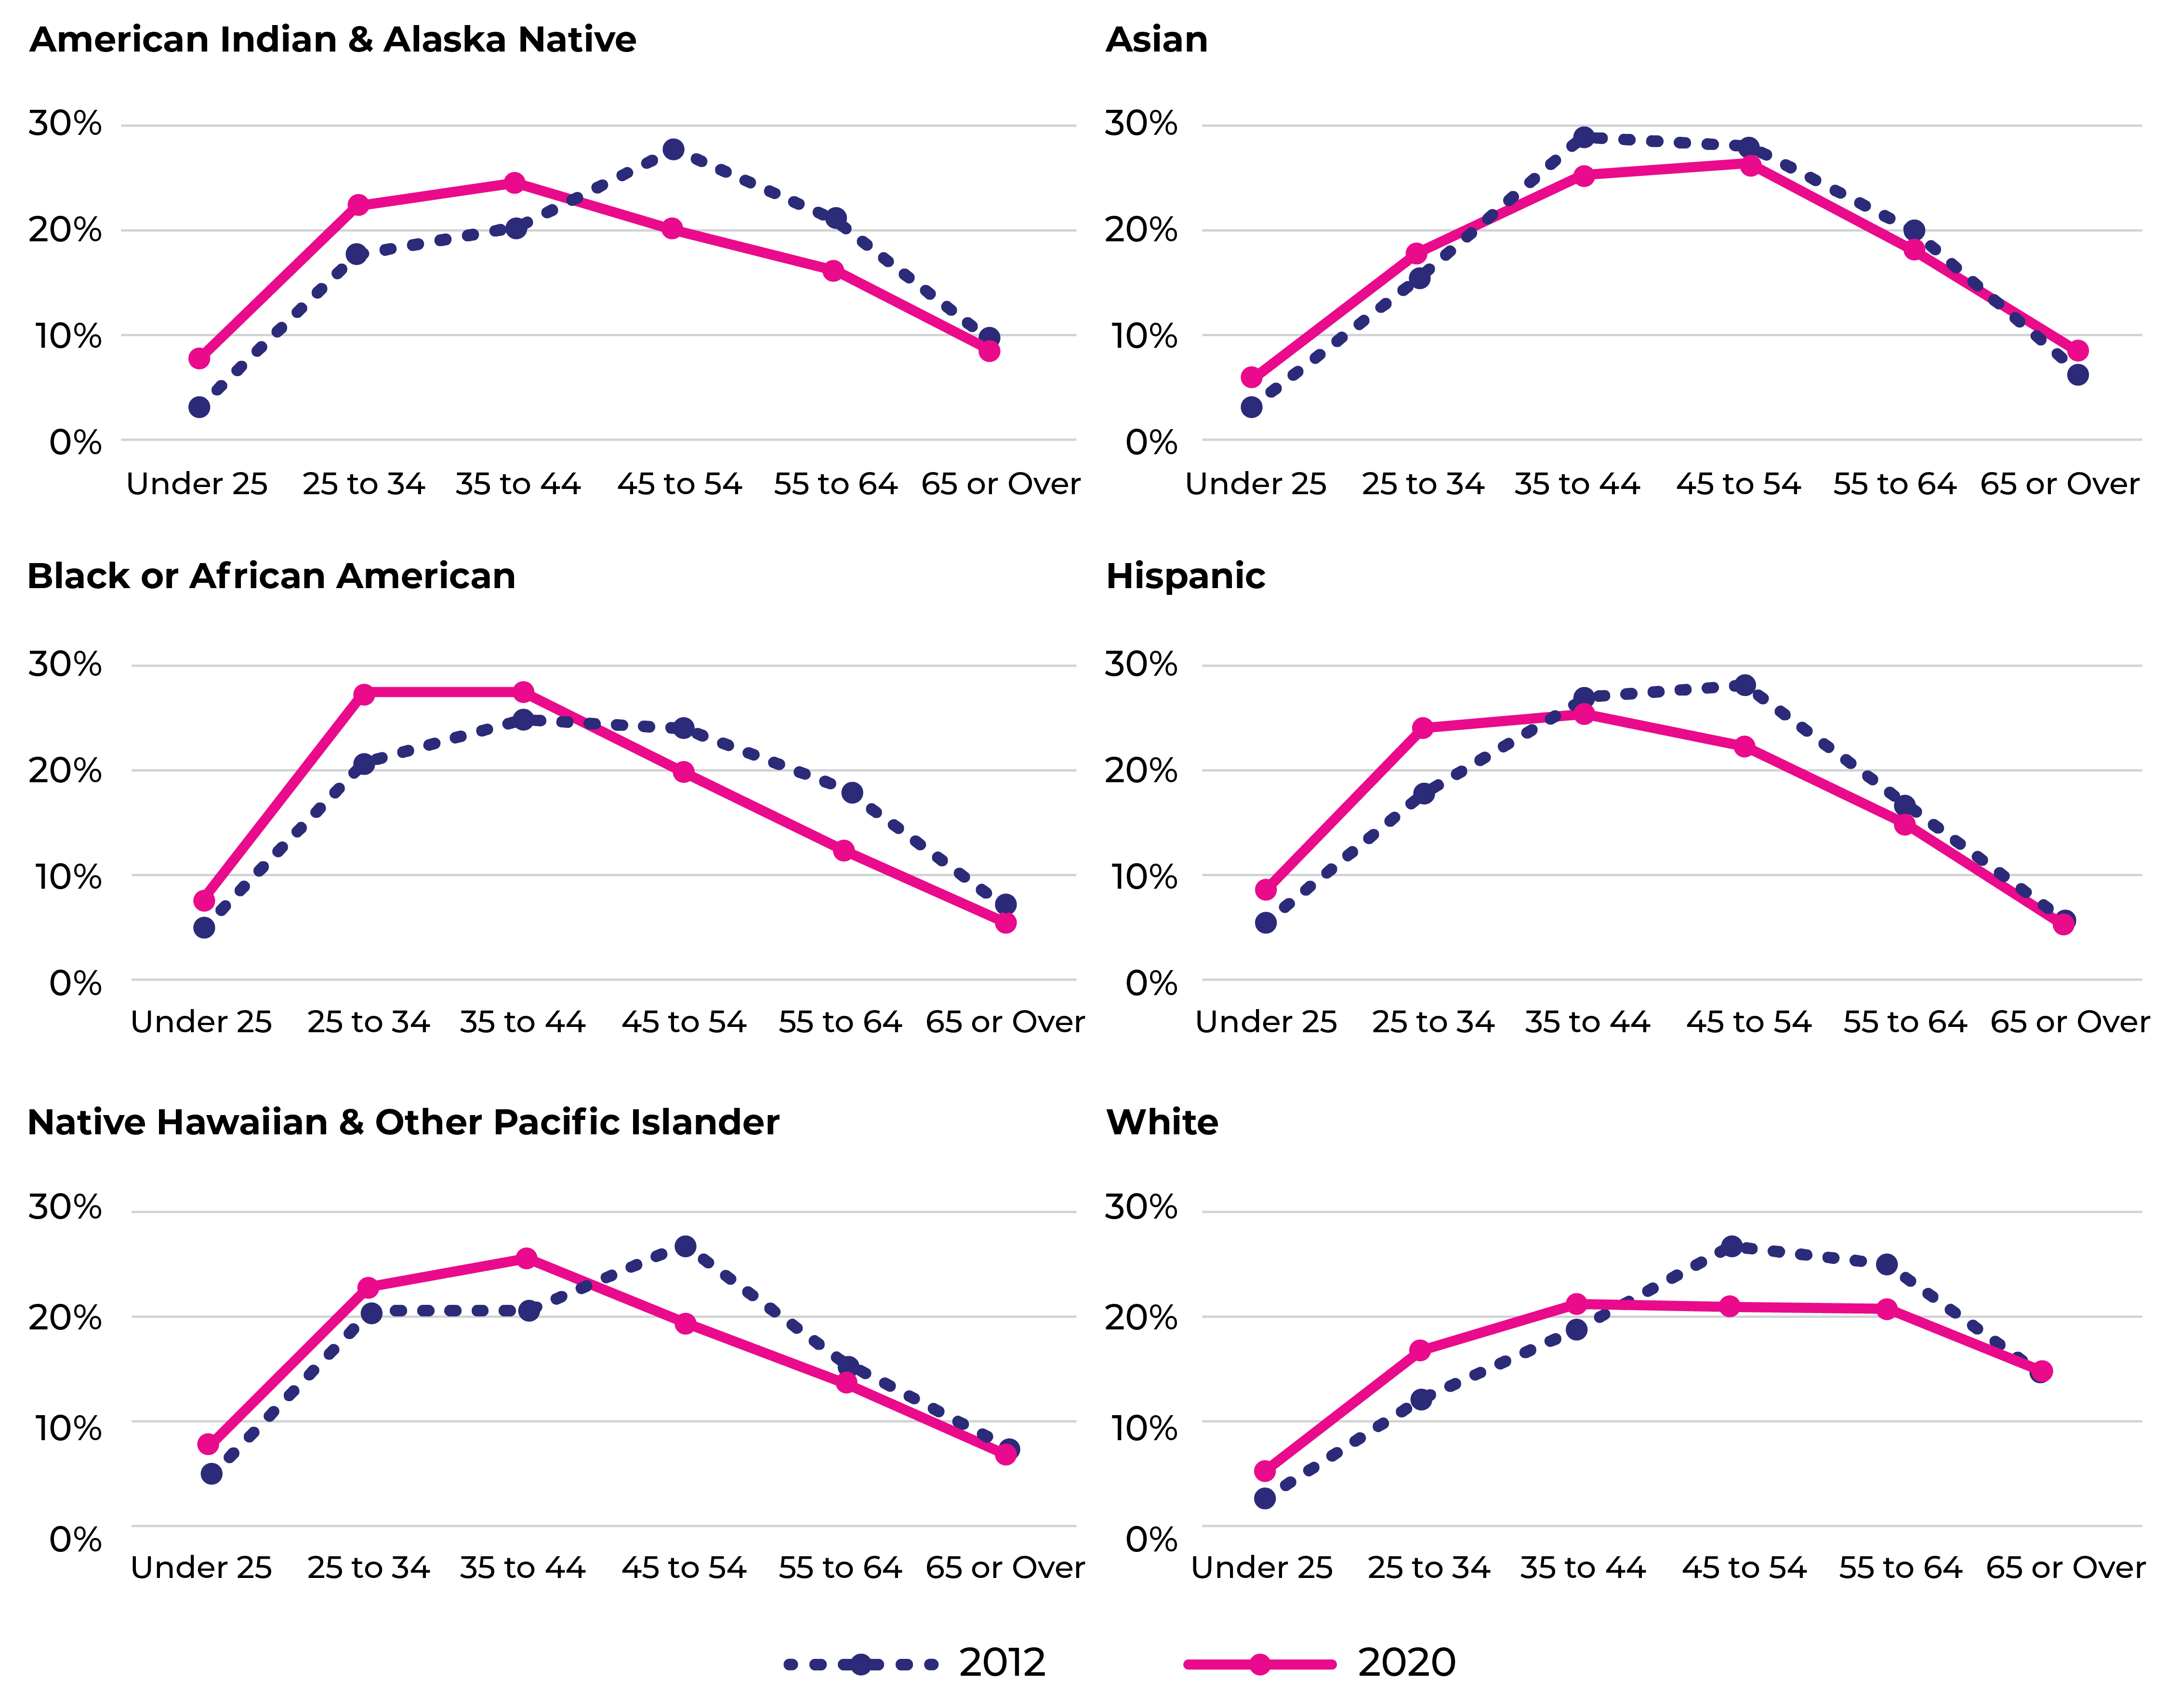
Women owners are generally older, but how does age differ by race and ethnicity? We see similar shares when we look at the historical distribution of owners’ age by race and ethnicity, with younger women’s ownership rates trending upward, as shown in Figure 8. The growth was spearheaded by Hispanic and Black or African American women under 35 years old. Specifically, the ownership rate of Hispanic women under the age of 35 went from 23.2 percent to 32.5 percent, an increase of 9.4 percentage points between 2012 and 2020. In addition, Black or African American women in the same age group grew (+9.2 percentage points) their rate from 25.7 percent to 34.9 percent. Meanwhile, owners 55 and over experienced slight declines in ownership, including a drop of 7.5 percentage points for Black or African American women, a decrease of 6.1 percentage points for American Indian and Alaska Native (AIAN) women, and a 3.8 percentage point reduction for White women during this time period. Asian women in this age group reverse this deceleration with a gain of 0.3 percentage points in ownership. The reversal was pioneered by those 65 and older, with an increase of 2.1 percentage points in ownership between 2012 and 2020.
Figure 8. Women Business Ownership by Age and Race and Ethnicity
Sources: U.S. Census Bureau, 2012 Survey of Business Owners, 2021 Annual Business Survey, data year 2020, and 2020 Nonemployer Establishment Statistics-Demographics (NES-D).
Striking differences are also observed when we look at industry by race and ethnicity of age groups, although findings that older owners are more involved in capital-intensive sectors than younger ones still hold. For instance, employer business owners 55 years or older are more involved in industries such as manufacturing, wholesale trade, finance and insurance, real estate and rental leasing, and administrative and support and waste management and remediation services. Conversely, younger employer owners are concentrated in industries that require less capital to start, such as arts, entertainment, and recreation; retail trade; information; and other services (except public administration). A few exceptions worth noting are Asian owners younger than 35, who made up a good chunk (40.0 percent) of all Asian owners in the mining, quarrying, and oil and gas extraction, a capital-intensive industry in 2020. Similarly, 40.0 percent and 16.1 percent of Hispanic women operating in the utilities and construction industries were under 35, both requiring a high amount of capital to run. Finally, Native Hawaiian & Other Pacific Islander (NHOPI) owners in the same age group also represented high shares, 36.8 percent and 22.2 percent among all NHOPI women who own businesses in the construction and manufacturing industries.
Table 5. Top 5 Industries by Race and Ethnicity: Employer Businesses
| Oldest Owners (55 and Over) | Industry Share | Youngest Owners (Under 35) | Industry Share |
|---|---|---|---|
| American Indian and Alaska Native | |||
| Agriculture, forestry, fishing and hunting | 95.9% | Wholesale trade | 16.9% |
| Finance and insurance | 58.7% | Retail trade | 13.0% |
| Retail trade | 50.3% | Professional, scientific, and technical.. | 11.3% |
| Real estate and rental and leasing | 47.5% | Manufacturing | 11.2% |
| Transportation and warehousing | 46.1% | Health care and social assistance | 10.7% |
| Asian | |||
| Manufacturing | 51.6% | Mining, quarrying, and oil and gas .. | 40.0% |
| Wholesale trade | 49.0% | Arts, entertainment, and recreation | 25.5% |
| Administrative and support and waste management and | 47.4% | Information | 15.3% |
| Real estate and rental and leasing | 44.4% | Transportation and warehousing | 10.7% |
| Finance and insurance | 40.9% | Accommodation and food services | 10.6% |
| Black or African American | |||
| Industries not classified | 63.6% | Information | 46.2% |
| Manufacturing | 63.1% | Other services (except public admin) | 12.2% |
| Wholesale trade | 55.9% | Retail trade | 11.8% |
| Real estate and rental and leasing | 53.9% | Arts, entertainment, and recreation | 11.8% |
| Administrative and support and waste management and .. | 49.3% | Accommodation and food services | 11.8% |
| Hispanic | |||
| Finance and insurance | 48.4% | Utilities | 40.0% |
| Manufacturing | 44.4% | Other services (except public admin) | 36.0% |
| Wholesale trade | 42.8% | Agriculture, forestry, fishing and hunting | 25.0% |
| Real estate and rental and leasing | 41.6% | Arts, entertainment, and recreation | 18.2% |
| Administrative and support and waste management and .. | 40.6% | Construction | 16.1% |
| Native Hawaiian and Other Pacific Islander | |||
| Wholesale trade | 95.5% | Agriculture, forestry, fishing and hunting | 100.0% |
| Real estate and rental and leasing | 68.1% | Educational services | 41.5% |
| Administrative and support and waste management and .. | 67.7% | Manufacturing | 36.8% |
| Health care and social assistance | 55.0% | Construction | 22.2% |
| Finance and insurance | 50.0% | Retail trade | 20.8% |
| White | |||
| Mining, quarrying, and oil and gas extraction | 73.5% | Arts, entertainment, and recreation | 11.5% |
| Wholesale trade | 64.7% | Information | 8.7% |
| Management of companies and enterprises | 64.3% | Other services (except public admin) | 7.6% |
| Manufacturing | 62.9% | Educational services | 7.5% |
| Industries not classified | 62.1% | Agriculture, forestry, fishing and .. | 7.4% |
Source: U.S. Census Bureau, 2021 Annual Business Survey, data year 2020
Just like employer business owners, nonemployer business ownership by industry sector and race and ethnicity drew similar conclusions, more (less) capital—older (younger) owner, except for a few cases. Older nonemployer owners (aged 55 and over) are mainly concentrated in the mining, quarrying, and oil and gas extraction; real estate and rental and leasing; utilities; finance and insurance; and the health care and social assistance industries. As we observed with employer owners younger than 35, nonemployer owners are mostly distributed in non-capital-intensive industries such as arts, entertainment, and recreation; agriculture, forestry, fishing, and hunting; information; and other services (except public administration). The few exceptions among women owners of this age group include Native Hawaiian and Other Pacific Islanders and Hispanics, who accounted for 45.4 percent and 44.5 percent of the transportation and warehousing industry within race and ethnicity groups, respectively, in 2020. Moreover, Hispanic, AIAN, and Asian women owners made up 40.9 percent, 36.2 percent, and 29.5 percent of construction industry owners within race and ethnicity group, respectively.
Table 6. Top 5 Industries by Race and Ethnicity: Nonemployer Businesses
| Oldest Owners (55 and Over) | Industry Share | Youngest Owners (Under 35) | Industry Share |
|---|---|---|---|
| American Indian and Alaska Native | |||
| Mining, quarrying, and oil and gas extraction | 57.8% | Transportation and warehousing | 44.5% |
| Real estate and rental and leasing | 42.4% | Arts, entertainment, and recreation | 40.5% |
| Utilities | 39.4% | Agriculture, forestry, fishing and hunting | 39.1% |
| Finance and insurance | 34.6% | Other services (except public administration) | 37.0% |
| Manufacturing | 30.6% | Construction | 36.2% |
| Asian | |||
| Mining, quarrying, and oil and gas extraction | 45.1% | Transportation and warehousing | 43.2% |
| Real estate and rental and leasing | 38.6% | Arts, entertainment, and recreation | 42.6% |
| Agriculture, forestry, fishing and hunting | 33.3% | Information | 39.3% |
| Health care and social assistance | 32.8% | Educational services | 31.8% |
| Finance and insurance | 31.0% | Construction | 29.5% |
| Black or African American | |||
| Mining, quarrying, and oil and gas extraction | 42.2% | Other services (except public administration) | 47.8% |
| Real estate and rental and leasing | 33.8% | Arts, entertainment, and recreation | 45.7% |
| Finance and insurance | 29.1% | Transportation and warehousing | 43.0% |
| Utilities | 26.6% | Information | 38.7% |
| Health care and social assistance | 23.0% | Agriculture, forestry, fishing and hunting | 35.7% |
| Hispanic | |||
| Real estate and rental and leasing | 33.3% | Arts, entertainment, and recreation | 50.4% |
| Mining, quarrying, and oil and gas extraction | 30.8% | Information | 44.8% |
| Health care and social assistance | 25.7% | Transportation and warehousing | 44.2% |
| Finance and insurance | 22.3% | Construction | 40.9% |
| Wholesale trade | 21.8% | Agriculture, forestry, fishing and hunting | 40.6% |
| Native Hawaiian and Other Pacific Islander | |||
| Mining, quarrying, and oil and gas extraction | 64.7% | Arts, entertainment, and recreation | 48.4% |
| Real estate and rental and leasing | 37.9% | Transportation and warehousing | 45.4% |
| Utilities | 29.4% | Information | 43.5% |
| Wholesale trade | 27.6% | Agriculture, forestry, fishing and hunting | 42.8% |
| Health care and social assistance | 26.8% | Other services (except public administration) | 37.5% |
| White | |||
| Mining, quarrying, and oil and gas extraction | 72.0% | Transportation and warehousing | 40.4% |
| Real estate and rental and leasing | 54.5% | Arts, entertainment, and recreation | 35.1% |
| Utilities | 47.7% | Agriculture, forestry, fishing and hunting | 30.5% |
| Finance and insurance | 47.6% | Information | 30.1% |
| Manufacturing | 39.4% | Construction | 29.9% |
Source: U.S. Census Bureau, 2020 Nonemployer Establishment Statistics-Demographics (NES-D).
In conclusion, due to their growth, increasing performance, and significant contributions to the United States economy, women-owned businesses have spurred the interest of policymakers, researchers, and advocacy groups. Using various data products from the Census Bureau’s Business Demographics Program, this study finds that women owners differ across business and owner characteristics when we zero in on age. We find that young owners experienced growth in ownership between 2012 and 2020 and that younger businesses were mostly owned by women under the age of 35 in 2021. Furthermore, we noticed that among women aged 45 to 54 and those aged 55 to 64, ownership rates declined 5.5 percent and 4.8 percent between 2012 and 2020, implying an acceleration in the dropout of entrepreneurship for mid- to late-career age groups. These findings emphasize that although existing entrepreneurial theories have shown that older owners tend to have more resources that correlate with age, such as human capital, financial capital, and social capital, young owners are still making the decision to start businesses.
ENGINEERING CHANGE: A BLUEPRINT FOR STRENGTHENING WOMEN’S STEM ENTREPRENEURSHIP
KEEE, LLC performed research for NWBC in FY24 to further understand female entrepreneurship in high-yield and high-growth industries. In the first phase of the project, the firm conducted a comprehensive literature review and custom analysis of data from the U.S. Census Bureau about employer and nonemployer businesses, resulting in the publication of the report, An Illuminating Moment: Lighting a Pathway for Women STEM Entrepreneurs. In the second phase, building on landscape scan findings, the firm collected and examined data7 on women-owned businesses from 2012 through 2020 and studied the impact of variables that influence these entrepreneurs.
This work has revealed both expected and surprising national trends and effects of greatly varying magnitude, details of which are published in the report, Engineering Change: A Blueprint for Strengthening Women’s STEM Entrepreneurship. Through data analysis, researchers discovered that female STEM firms are concentrated in the professional and health care sectors. There is a positive relationship between the numbers of female STEM entrepreneurs and female patentee numbers, female venture funding levels, and labor force numbers:
- A 1 percent increase in the number of women patentees produces about a 0.56 percent increase in the number of women STEM entrepreneurs.
- A 1 percent increase in female venture capital funding (funding to female-founded and cofounded firms) leads to a .29 percent increase in the number of female STEM entrepreneurs.
- An increase in the national labor force of 1 percent results in a 37 percent increase in the number of these entrepreneurs. A United States Patent and Trademark Office (USPTO) study8 mentions better childcare options and increased networking opportunities for women entrepreneurs due to a large labor force.
Higher interest rates lead to a decline in female STEM firm numbers, but not by a large percentage. If interest rates rise by one percentage point, it will cause a 0.08 percent decrease in the number of women STEM entrepreneurs. The magnitude may be small because most of these businesses are nonemployer firms, which, because of their low capital requirements, are less susceptible to interest rate changes.
There is a negative relationship between female STEM entrepreneur numbers and per-capita incomes. A 1 percent increase in per-capita real income causes a close to 3 percent decrease in the number of women STEM entrepreneurs. Higher per capita incomes could act as a supply variable instead of a demand variable that stimulates the demand for female STEM firms’ services. With the flexibility that higher incomes provide, women could prioritize raising families over starting businesses. Also, the gender disparity in incomes and the glass ceiling that women face in the STEM workforce leads some of them to start businesses. With higher incomes, this may no longer be the case. In other words, when good jobs are available, women seize the option.
Most surprisingly, an increase in female STEM graduates leads to a decrease in the number of female STEM entrepreneurs in sectors as diverse as fabricated metal product manufacturing to data processing, hosting, and related services. The academic credentials needed for these sectors could be very different. A 1 percent increase leads to a 9.9 percent fall in the number of entrepreneurs in business.
Finally, COVID-19 led to an increase in the number of female STEM entrepreneurs. Among the many reasons for this contrary result are that early-stage female entrepreneurs reported finding new opportunities during the pandemic;9 women STEM entrepreneurs are concentrated in the healthcare sector, which grew during COVID-19; the second round of pandemic funding through community organizations benefited these entrepreneurs; direct cash payments to families helped women start new businesses; and economic necessity drove rising entrepreneurship.

This research found wide variations between the experiences of women STEM entrepreneurs of different races and ethnicities. Declines in women’s STEM entrepreneurship that are associated with increases in STEM degree attainment are particularly pronounced for women of color, with a 1 percent increase in graduates corresponding to a 31 percent decline in Black women-owned STEM firms, a 240 percent decline in AIAN women-owned STEM firms, a 45 percent decline in Asian women-owned STEM firms, and a 32.6 percent decline in Latina-owned STEM firms. In addition, STEM firm numbers owned by Black, Hispanic, and Asian women react more positively to increases in female patentee numbers and venture capital funding than female STEM firm numbers in the white and non-Hispanic categories.
This analysis found a surprising disconnect between women’s achievement in STEM fields in the academic and business worlds, but it doesn’t reveal the reasons for it. However, the literature review that preceded and inspired it is helpful in noting relevant phenomena. Consistent with the body of knowledge accumulated here, reasons for the negative correlation between women’s STEM education and STEM business ownership may include women’s concentration in particular industries and resulting high levels of competition; the self-reinforcing nature of gender disparities in ownership and the lack of descriptive role models and mentors for women in high growth/high yield fields; and women making the choice to stay in academia, in part because the sector supports their social and altruistic goals for developing products and services.
WOMEN’S ENTREPRENEURSHIP IN RURAL, TRIBAL, AND UNDERSERVED COMMUNITIES
NWBC recognizes that women entrepreneurs in the most overlooked and disconnected communities face unique challenges and benefit from tailored support. To better understand their experiences and needs, the Council commissioned research carried out by dfusion, Inc. in the past year. Following an extensive literature review, in Phase 2 of this project, dfusion Inc. conducted in-depth interviews10 with women entrepreneurs from rural areas and among Indigenous women to learn what resources women entrepreneurs in these areas have used, recommend, and would want. The highlights of these report findings are following.
Common Themes in Interviews with Indigenous Women Entrepreneurs
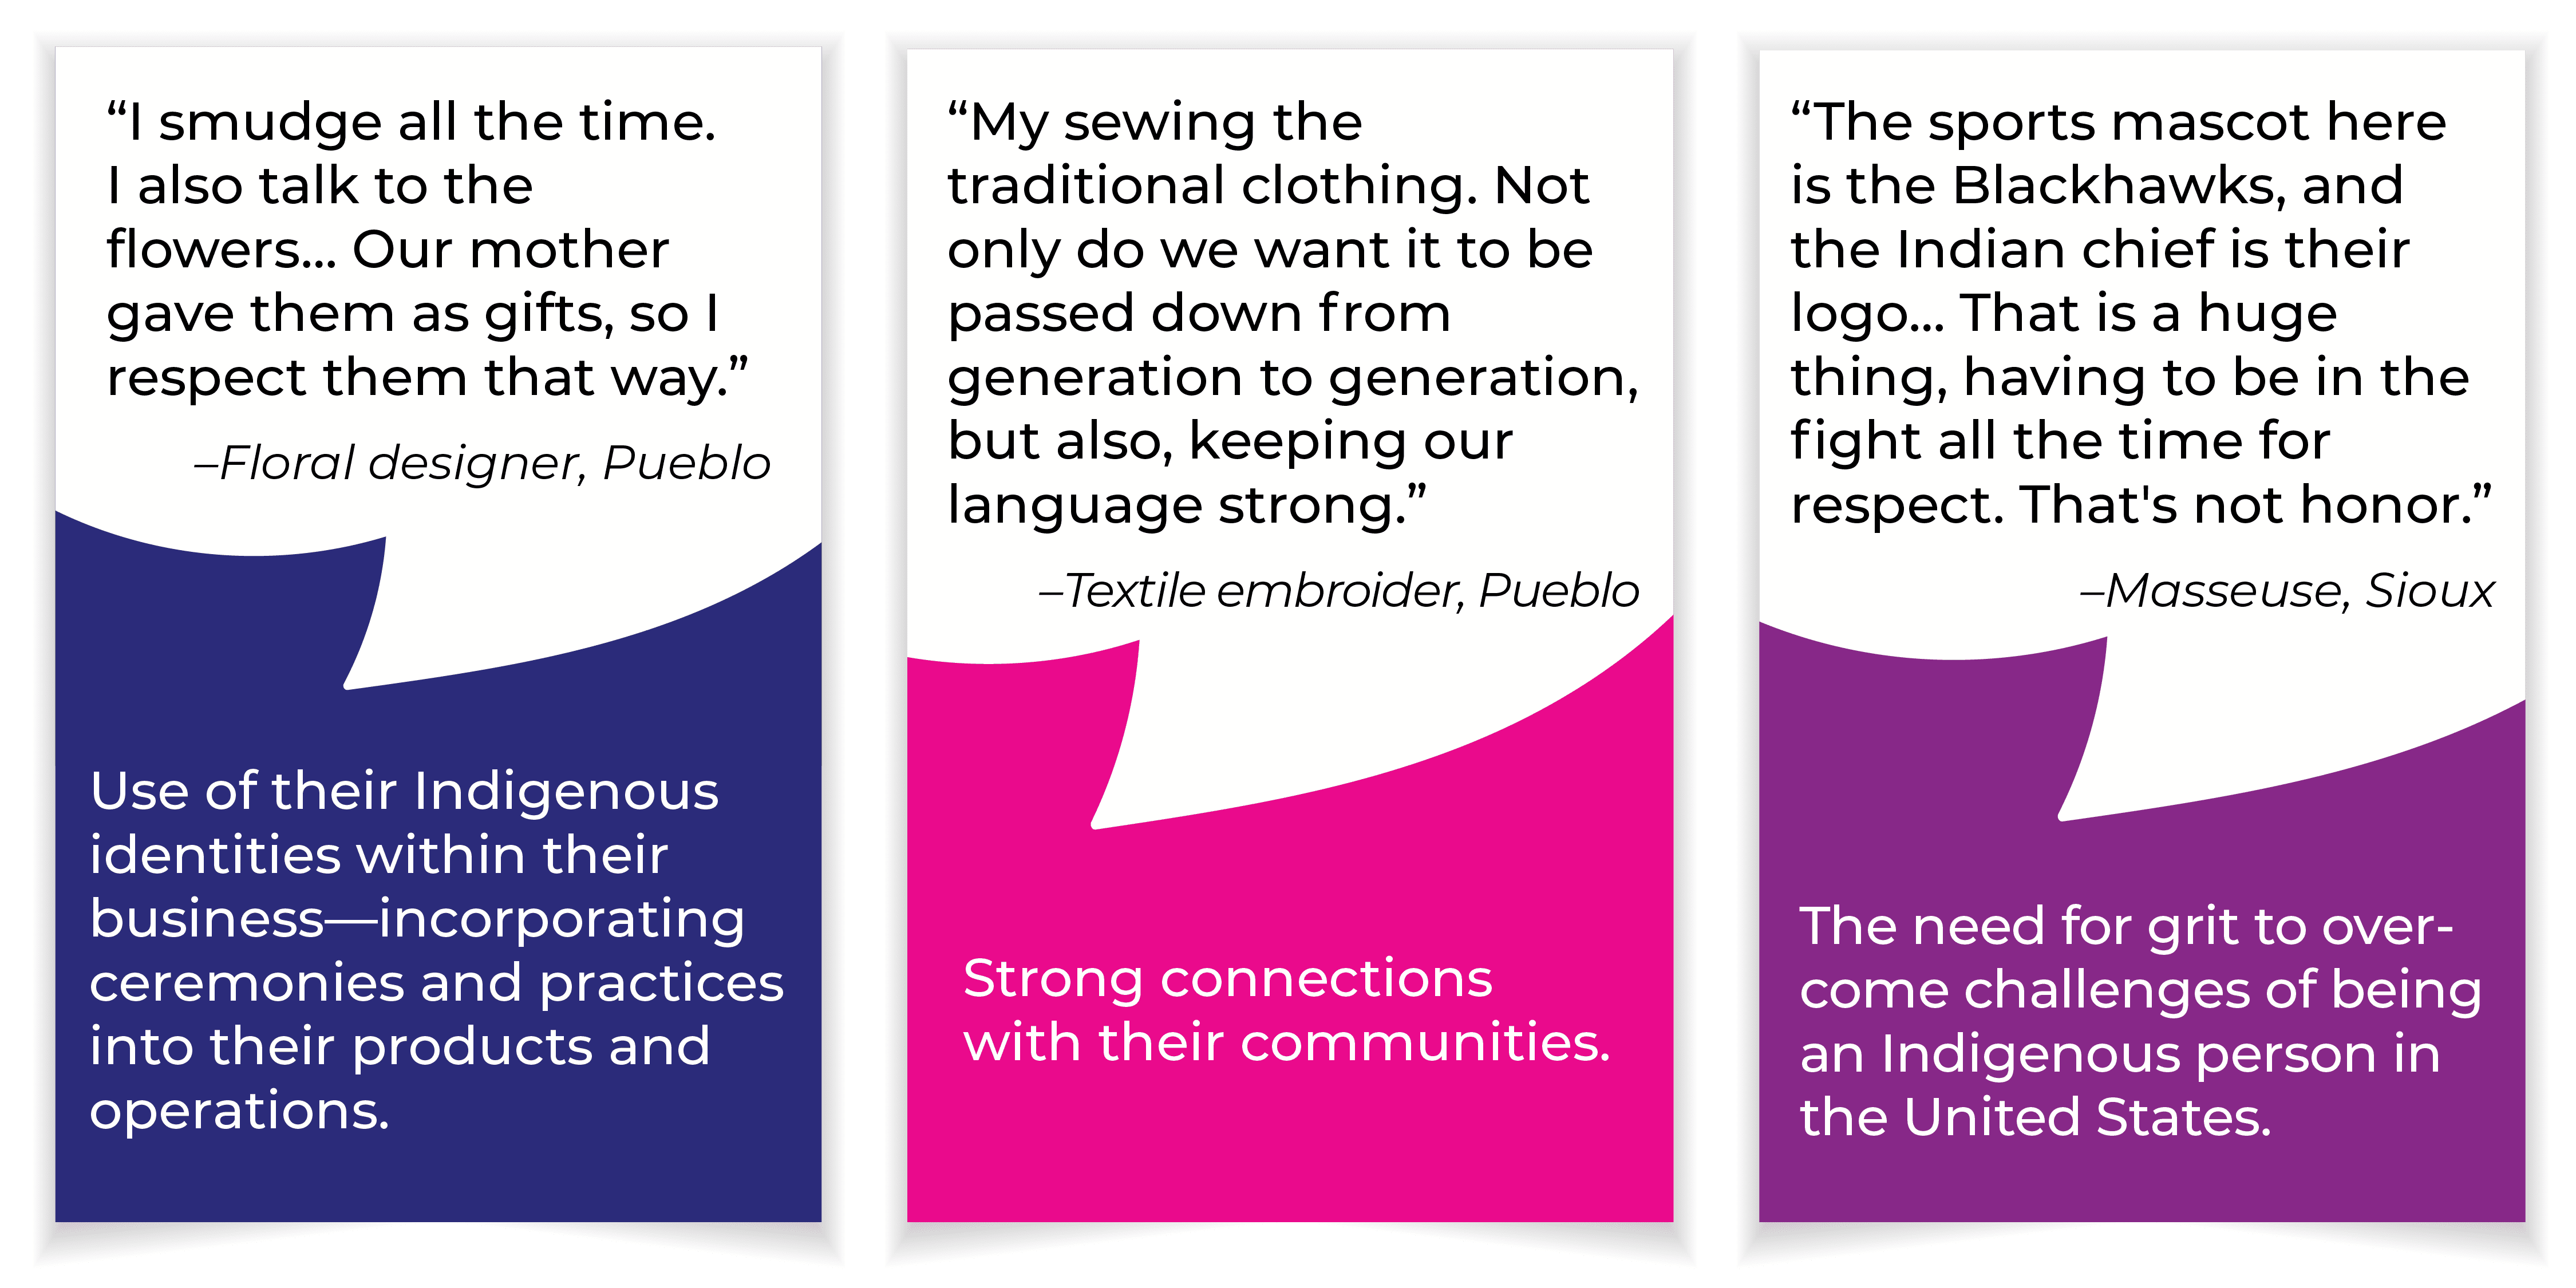
Education and Networks
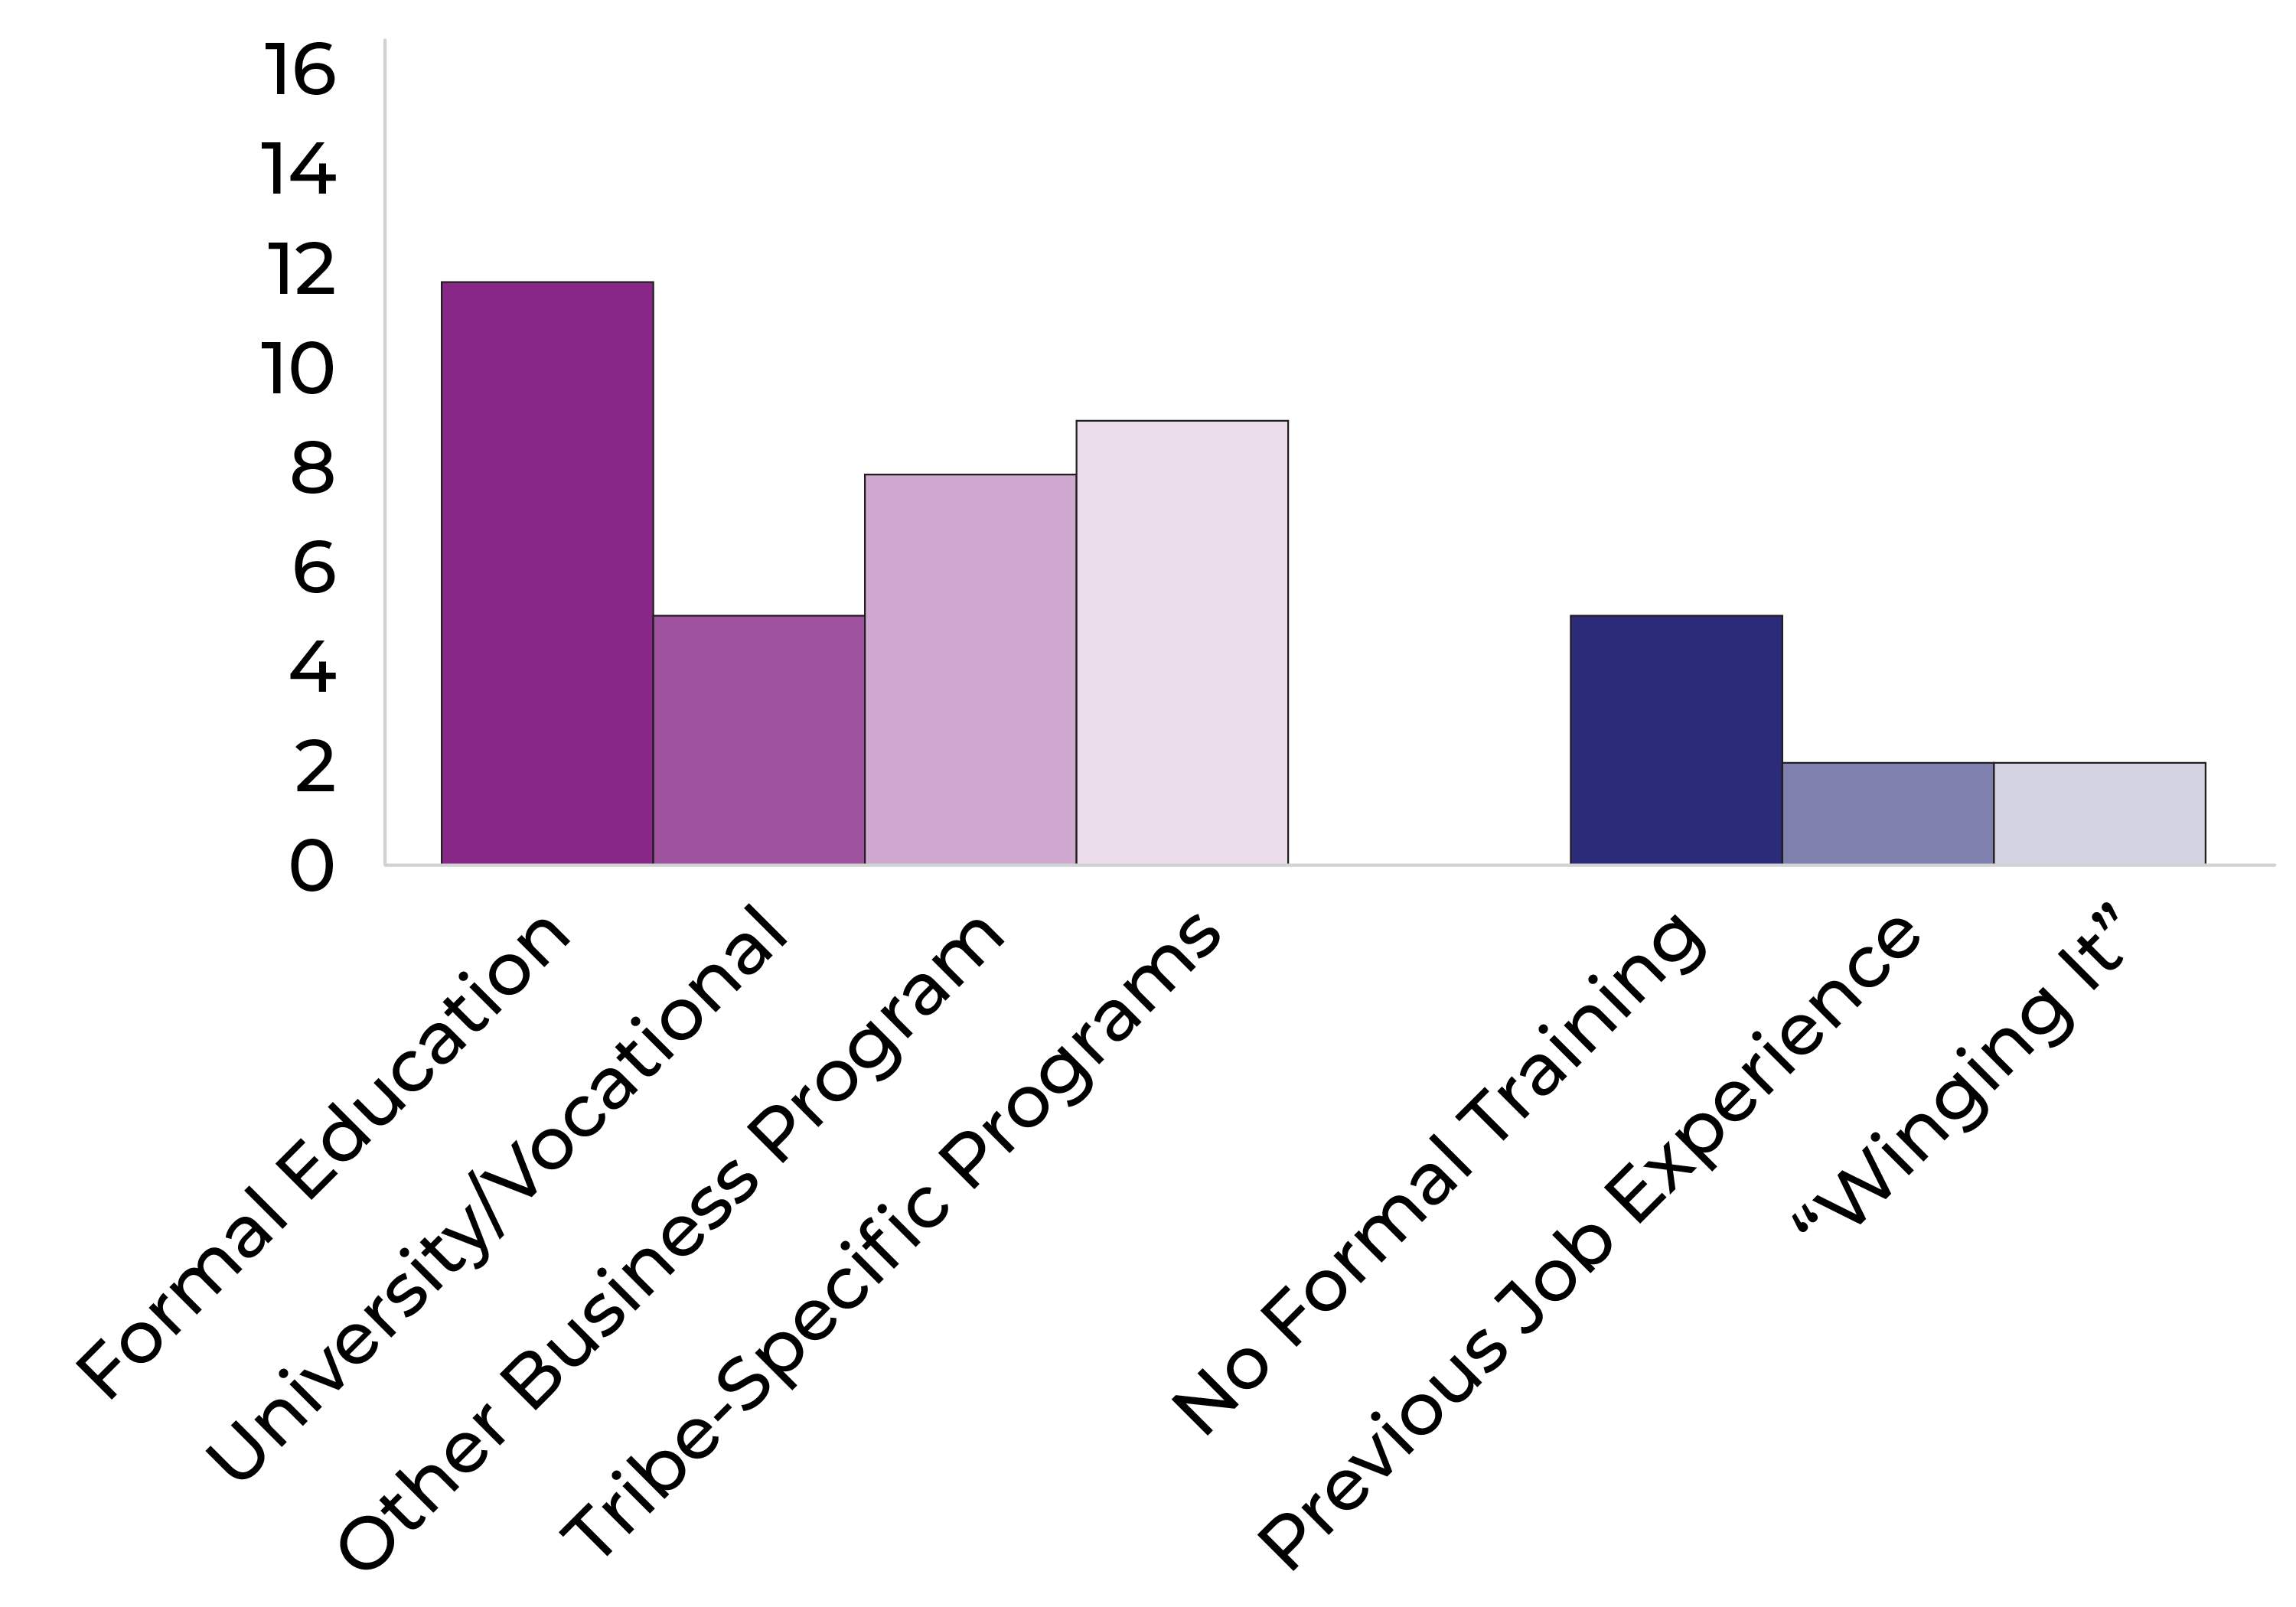
While 71 percent of Indigenous participants completed some sort of formal business training through a university, vocationalspecific training, or programs designed to train business skills, 9 of the 12 women in New Mexico completed Tribe-sponsored trainings focused on teaching business owners how to navigate business within the Tribes and found this specific training extremely useful. Further, 76 percent of the women reported using formal or informal mentors when starting and running their businesses. Those who secured mentors through Tribal programs knew their mentors were compensated, and a desire to see mentors compensated was noted by several participants. Similarly, almost all participants reported participating in Tribal- and vocational-specific networks to learn further business skills.
Figure 9. Number of Indigenous Women Business Owners Who Reported Different Modes of Education
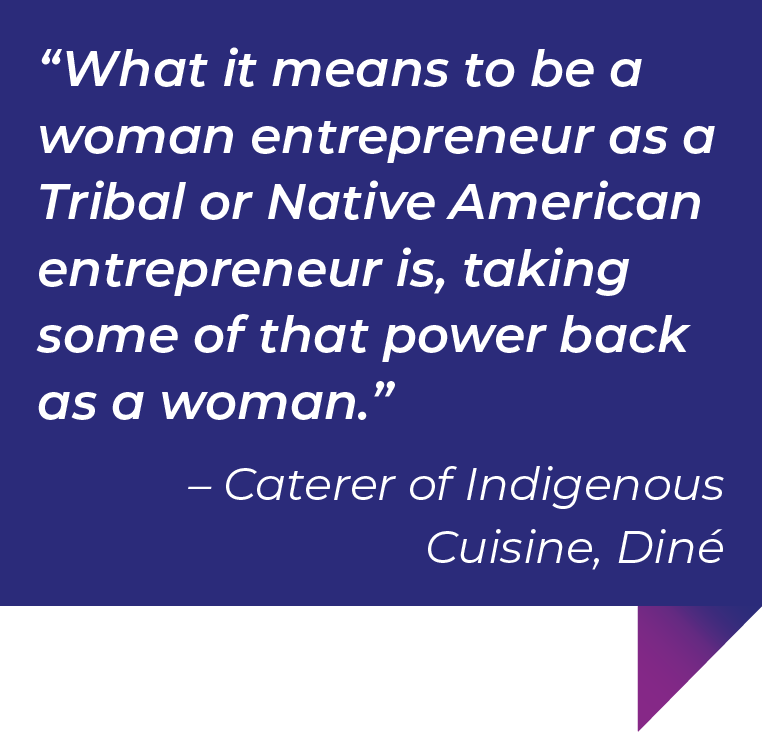
Financing and Other Resources
A common theme that emerged was that some participants had no interest in loans because they did not want to owe a bank or financial entity, with only 24 percent applying for startup loans. However, women were more willing to and had applied for grants that did not need to be repaid. Still, 71 percent relied solely on self-funding. One woman reported that she did not qualify for loans because her home was on trust land; thus, she could not use it as collateral. A need for micro-loans and grants with low interest rates was noted, and loans from Tribal groups seemed more palatable than the Small Business Administration (SBA) loans for those who did apply.
Internet was considered essential for almost all participants, though internet on reservations was limited, with fiber internet not being available for residential use despite being installed in some areas for public buildings. Childcare largely fell on women staying home or family members, as quality and affordable childcare was difficult to access across both areas surveyed. Finally, transportation needs were only met by personal vehicles, as public transit was virtually nonexistent in both areas.
Awareness and Use of Existing Federal Resources
To summarize, the awareness of federal resources was almost nonexistent among the participants. Nobody knew what it meant to be certified as a WOSB, and only one person had heard of the Women’s Business Centers (WBCs) but thought those were only appropriate for women living in cities. While 10 of the women had at least heard of SBA, only five of those attempted to use SBA resources, and only three would recommend SBA resources to other Indigenous women. Seventy-one percent of participants noted that one of the best ways to market existing resources would be to increase outreach efforts, potentially using trusted community members as ambassadors from Tribal groups to increase buy-in and trust.
Tribal Realities
Indigenous women face discrimination from within their communities and outside of them. Between patriarchal cultures pushing out single, unmarried women from Tribal spaces and denying a trans woman the ability to re-register with her Tribe after legally changing her name and gender, there are norms that can impede women’s participation in business. Indigenous women also face discrimination from outside the community. The Quechua artist often gets passed over for her work being “too Native.” The Diné restorative farmer was denied a loan despite their stellar credit. The Hopi vegan restaurateur and the Sioux masseuse have been tokenized for their Native faces. There is a lot to overcome, as unfair as that statement may be.
However, there is also a lot of strength in Tribal cultures, largely surrounding a strong sense of community. Most Tribes do not have a “for-profit” culture and instead focus on building the community. This is a strength of Indigenous people and increases the resiliency and grit of the individual as part of the group. Seventy-one percent of the participants defined “success” for their business as seeing people enjoying their product, participating in cultural practices, and building community, and 82 percent reported that the most rewarding part of being an Indigenous woman entrepreneur was seeing people participating in their culture; 53 percent explicitly started their business ventures as an avenue to share their culture and give back to their community.
Common Themes in Interview with Rural Women Entrepreneurs
![It started off as just a very simple gift shop, mostly locally sourced items. It had been something I always wanted to do.” Owner of boutique shop, West Virginia. Strong sense of community and family – focusing on local markets and supply chains. “To bring somebody here, we need more resources, more entertainment, more just everything. It’s because [the county’s] under 10,000. We just don't have a ton to offer.” Dentist, Minnesota. Limited resources posed challenges for maintaining and scaling businesses. “I had to struggle to be credible. And I've always told my daughters that too, to be half as credible, you have to work twice as hard because you don't wear boxers.” Retail home decorator, Iowa. Grit, resilience, and creativity play large roles in maintaining a rural business.](assets/img/common_themes_graphic_2_01.png)
Education and Networks
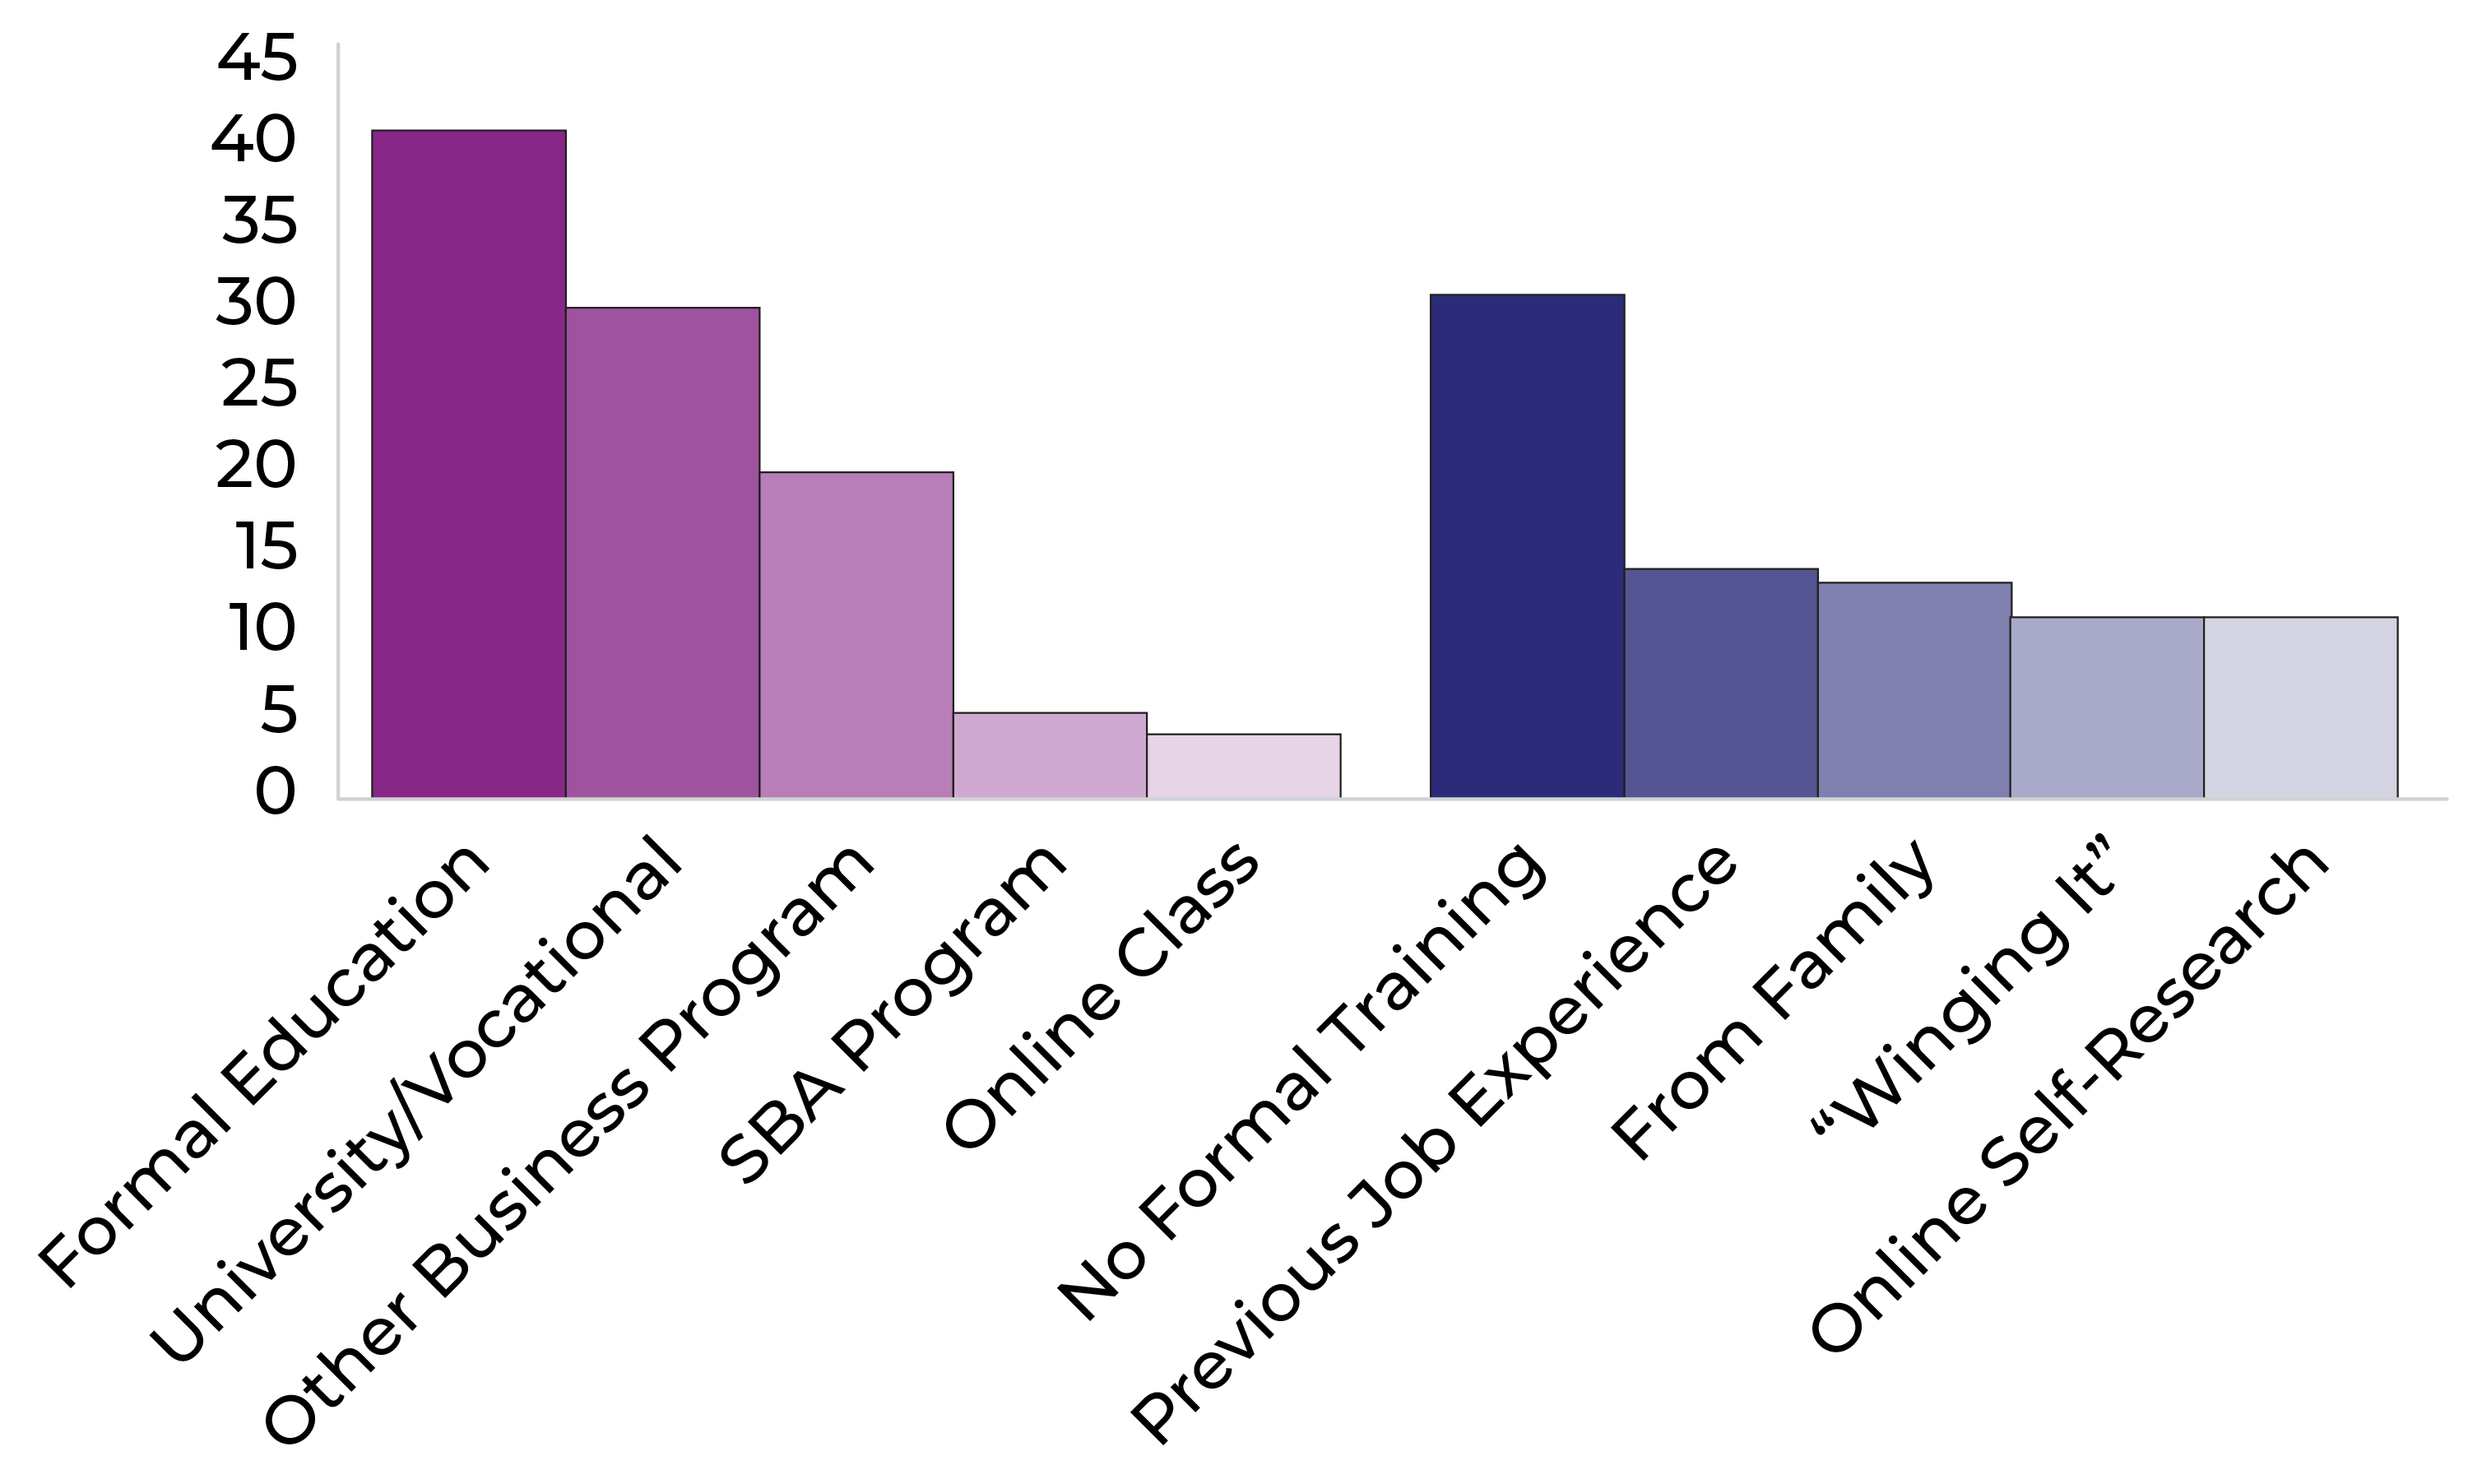
Business education varied greatly among the rural women participants, with 55 percent having received some sort of formal education; however, among the 40 percent who had vocational or university training, many supplemented that vocational training with online business classes, other programs, and seeking information from online sources because the formal education was not enough specifically for learning business practices. While 41 percent did not report having any explicit, formal training to start their businesses, many learned from families, networks, and mentors, while some were content to just “wing it” and learn through their own experience.
Figure 10. Number of Rural Women Business Owners Who Reported Different Modes of Education
While almost all of the participants used some type of formal or informal mentor, only four paid for their mentorship experience. Further, only 40 percent of participants reported being members of professional networks and chambers of commerce, though an additional 24 percent were members of online groups on social media and LinkedIn. However, almost all have used personal networks in their communities to grow their businesses.
Financing and Other Resources
Only 15 percent of participants reported having applied for loans, and 9 percent had applied for grants. Some mentioned that they did not apply because of the complexity of the application process, and others did not qualify for loans due to their credit or financial status. The farmers in the sample were more likely to have applied for and received Farm Service Agency (FSA) or U.S. Department of Agriculture grants when they had formal agricultural education, while other small-scale farmers were unable to apply for similar loans because of the scale of their production or location in unincorporated towns, which led to FSA service centers sending one woman to three different locations, none of whom aided her in applying for a loan.
High-speed internet was seen almost equally as important; however, access to it was largely regional and, in some places, extremely expensive. Similarly, quality childcare was cost prohibitive for most unless they or their family were able to assist in childcare. Even the participants who did not have children noted that childcare was difficult to access in their communities. Much like the Indigenous women’s responses, most rural women business owners also relied on personal vehicles for transit, which could be costly for fuel.
Awareness and Use of Existing Federal Resources
Again, similar to the Indigenous women, awareness of federal programs was extremely low. Only 16 percent of the rural women had heard of the SBA, with only 4 percent having used their resources; 4 percent had heard of WBC, with two women having used them; and 11 percent of the participants had heard of the WOSB certification, though none had registered their business as a WOSB. However, the women did voice a desire to see more resources allocated toward providing financial support, business-specific education, mentorship, networking opportunities, and localized personal support. They also mentioned that having more outreach in their communities might bolster engagement, and a mixture of online and in-person events would be helpful.
Rural Realities
While many of the themes that emerged about the cultural norms in rural communities were specific to the region, there were some overarching themes, including the reputations of both the business owners and their businesses, which were vital for business operations in small communities. Being too politically “loud” could adversely affect their businesses. In some communities, a flourishing group of women business owners was extremely supportive, while in others there was less support and sometimes even “cliques.” This highlights the need for outreach and programming efforts to be at least partially tailored to specific communities.
Rural women entrepreneurs are motivated by gaining independence and to support their families and communities. While they were more likely to cite financial success as their main measure of success (25 percent) than Indigenous women,
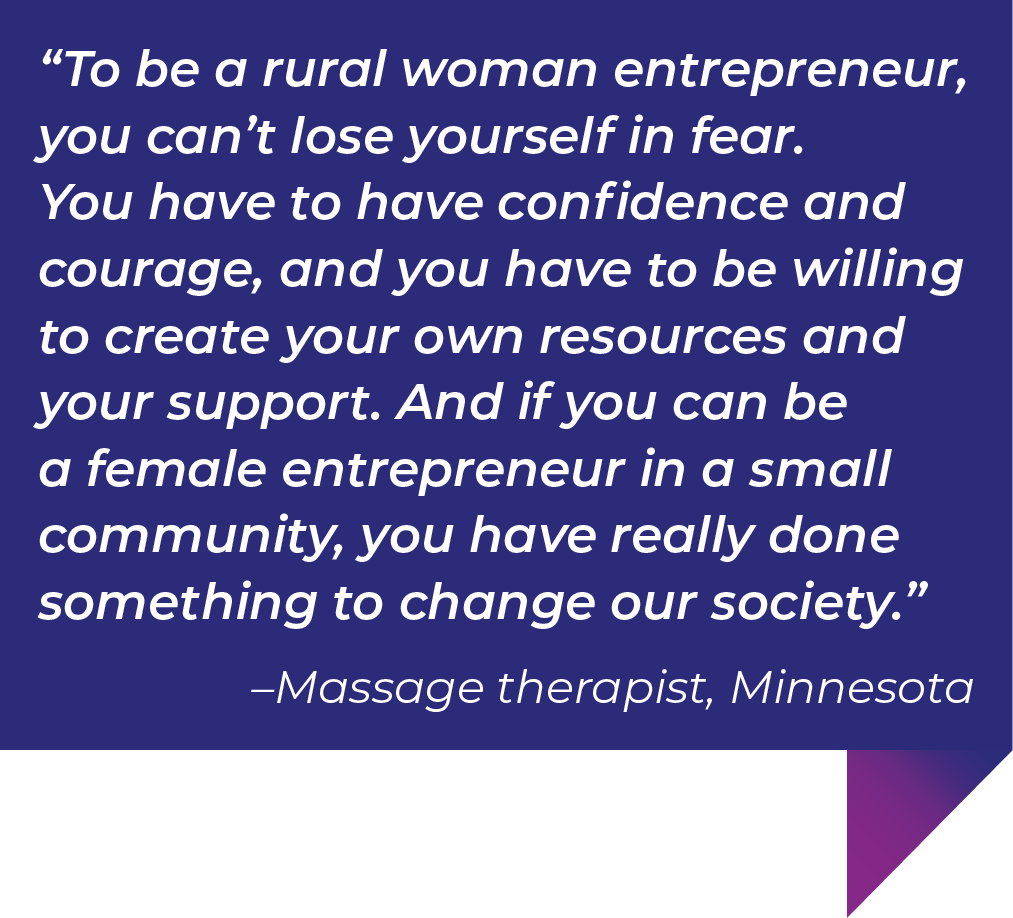
there was still not a huge emphasis on the bottom line when looking at the “success” of the business. The interviews revealed a blurred line between personal and professional lives. The businesses are often deeply intertwined with personal life, especially in family-owned businesses or those run from home. Once again, this intersection presents both benefits (such as flexibility and family involvement) and challenges (such as difficulty maintaining boundaries and managing time).